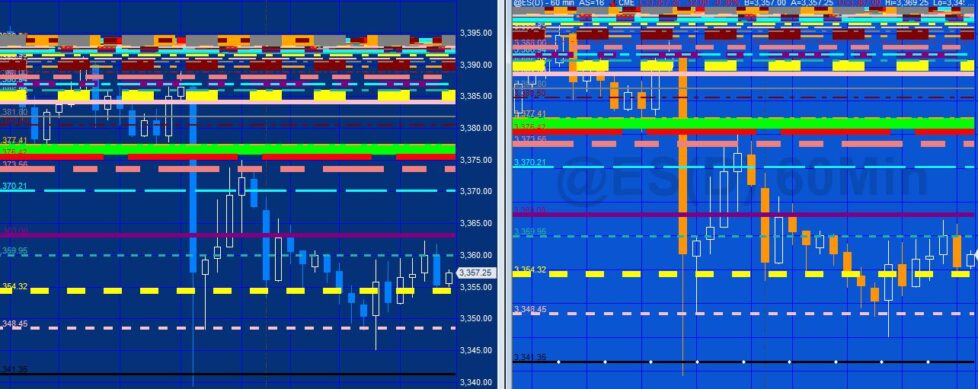
Tutorial 151 demonstrates how to create TradeStation EasyLanguage programs to ‘sync’ lines between two charts using the Global Dictionary. The technique could be useful, for example, if you were using a program that was protected (i.e. you cannot see the code or modify it) that produced drawing objects on a chart. You might wish to replicate those drawing objects on another chart.
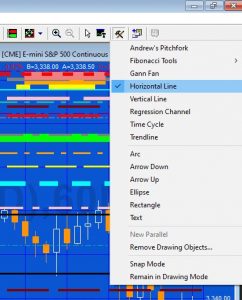
Tutorial 151 shows a way of doing this with horizontal lines drawn by an example program (included in the download).
| Programs applied to the ‘sending chart’ | |
| _Tutorial151-DrawLines | Generates horizontal lines, somewhat randomly and modifies their colors, styles and weights |
| _Tutorial151-ScrapeDrawingObjectData | Analyzes the chart and stores the horizontal lines and their attributes in a Global Dictionary |
| Program applied to the receiving chart | |
| _Tutorial151-ReadDictionary | Reads the Global Dictionary and draws the lines and their attributes on the ‘receiving’ chart. Adds additional horizontal lines if they are drawn on the sending chart. |
Tutorial program overviews
_Tutorial151-ScrapeDrawingObjectData inputs
When first applied to a chart _Tutorial151-ScrapeDrawingObjectData inputs stores all horizontal lines (either created by a program or drawn by a user) into a Global Dictionary. For each line the following information is stored:
- The price level
- The color (in fact the A (alpha), R (red), G (green), and B (blue) values are stored separately)
- The style of the line
- The weight of the line
These values are first added to a vector and then the vector is stored in the Global Dictionary.
The program monitors the chart using a timer. Each time a Timer events fires the program checks to see if any new lines have been added. If so those lines are added to the Global Dictionary.
If horizontal lines have been deleted the program throws a recalculate exception so that all the lines are reanalyzed and stored in the dictionary.
_Tutorial151-ReadDictionary

_Tutorial151-ReadDictionary is applied to the ‘receiving’ chart (i.e. the chart that you want the lines to be replicated from the sending chart. The program reads the global dictionary when it is first applied and draws the horizontal lines on the chart (matching their price, color, weight, and style attributes).
This program uses the Global Dictionary item added update event. When this is fired because one or more lines have been added to the chart, it draws the new lines on the receiving chart.
In the event that a line is deleted on the sending chart, the sending chart re-initializes and all the lines are added to the Global Dictionary again. When this occurs the receiving chart deletes all the horizontal lines on the chart and then re-draw all the lines.
_Tutorial151-ScrapeDrawingObjectData inputs
int iInterval1( 50000 ), // Interval for the timer
string ShareRef( “Send1” ); // Unique name to differentiate the Global Dictionary
_Tutorial151-ReadDictionary
string ShareRef( “Send1” ); // Unique name to differentiate the Global Dictionary
[fancy_box]The ShareRef input must be the same string for the sending and receiving charts for them to be able to share data.[/fancy_box]
Detecting when a horizontal line is added in the sending program
Tutorial 151 uses a timer event to continuously check the chart every so many milli-seconds (the user input iInterval1 in _Tutorial151-ScrapeDrawingObjectData.
With horizontal lines drawn using the drawing tools, the charting host could have been used to detect when a line was added to the chart. Unfortunately this would not work for lines added programmatically after the sending program was first applied to the chart.
- The tutorial programs only recognize horizontal line drawing objects (as opposed to vertical lines, trendlines etc)
- They do not recognize legacy drawing objects (lines produced by TL_New(… syntax)
- They do not take account of when a horizontal line is moved on the sending chart (with the exception of if it is applied and moved before the timer elapsed event occurs)
- When lines are deleted on the sending chart and remain deleted when the timer event fires the sender program throws a recalculate exception. This is not the most elegant solution and would effect other programs applied to the ‘sending’ chart, however it is a simple solution.
- When a line is applied to the chart its details are added to the Global Dictionary when the Timer event fires. If the line is subsequently deleted and a new line added before the Timer event fires again, the program does not recognize the deletion and addition. This is not a problem when the timer interval is set sufficiently low.
For Gold Pass members
The following section contains the code for _Tutorial151-Drawlines, the program that draws the randomly positioned, colored, styled and weighted lines:
- Using the global dictionary and vectors
- Storing a vector in a global dictionary
- Using the global dictionary item added update event
- Using a timer object
- Getting price, color, style and weight attributes from a horizontal line
- Processing colors
- Drawing horizontal lines and applying price, color, style and weight attributes
- Using methods to simplify code
The three programs described in this tutorial (_Tutorial151-DrawLines, _Tutorial151-ScrapeDrawingObjectData, _Tutorial151-ReadDictionary) are available for immediate download for $44.95. The download is a TradeStation ELD file that includes the unprotected and commented program. This program will not work in MultiCharts because it uses the TradeStation collections and other functionality that is not available in the MultiCharts environment.
Part 1 | Summary of tutorial 151 and description of _Tutorial151-Drawlines
Part 2 | Description of _Tutorial151-ScrapeDrawingObjectData
Part 3 | Description of _Tutorial151-ReadDictionary
Please email if you find any bugs, notice any errors, or have questions about the tutorial.
THESE INDICATORS, SHOW ME STUDIES, STRATEGIES AND OTHER PROGRAMS HAVE BEEN INCLUDED SOLELY FOR EDUCATIONAL PURPOSES.
TO THE BEST OF MARKPLEX CORPORATION’S KNOWLEDGE, ALL OF THE INFORMATION ON THIS PAGE IS CORRECT, AND IT IS PROVIDED IN THE HOPE THAT IT WILL BE USEFUL. HOWEVER, MARKPLEX CORPORATION ASSUMES NO LIABILITY FOR ANY DAMAGES, DIRECT OR OTHERWISE, RESULTING FROM THE USE OF THIS INFORMATION AND/OR PROGRAM(S) DESCRIBED, AND NO WARRANTY IS MADE REGARDING ITS ACCURACY OR COMPLETENESS. USE OF THIS INFORMATION AND/OR PROGRAMS DESCRIBED IS AT YOUR OWN RISK.
ANY EASYLANGUAGE OR POWERLANGUAGE TRADING STRATEGIES, SIGNALS, STUDIES, INDICATORS, SHOWME STUDIES, PAINTBAR STUDIES, PROBABILITYMAP STUDIES, ACTIVITYBAR STUDIES, FUNCTIONS (AND PARTS THEREOF) AND ASSOCIATED TECHNIQUES REFERRED TO, INCLUDED IN OR ATTACHED TO THIS TUTORIAL OR PROGRAM DESCRIPTION ARE EXAMPLES ONLY, AND HAVE BEEN INCLUDED SOLELY FOR EDUCATIONAL PURPOSES. MARKPLEX CORPORATION. DOES NOT RECOMMEND THAT YOU USE ANY SUCH TRADING STRATEGIES, SIGNALS, STUDIES, INDICATORS, SHOWME STUDIES, PAINTBAR STUDIES, PROBABILITYMAP STUDIES, ACTIVITYBAR STUDIES, FUNCTIONS (OR ANY PARTS THEREOF) OR TECHNIQUES. THE USE OF ANY SUCH TRADING STRATEGIES, SIGNALS, STUDIES, INDICATORS, SHOWME STUDIES, PAINTBAR STUDIES, PROBABILITYMAP STUDIES, ACTIVITYBAR STUDIES, FUNCTIONS AND TECHNIQUES DOES NOT GUARANTEE THAT YOU WILL MAKE PROFITS, INCREASE PROFITS, OR MINIMIZE LOSSES.

