

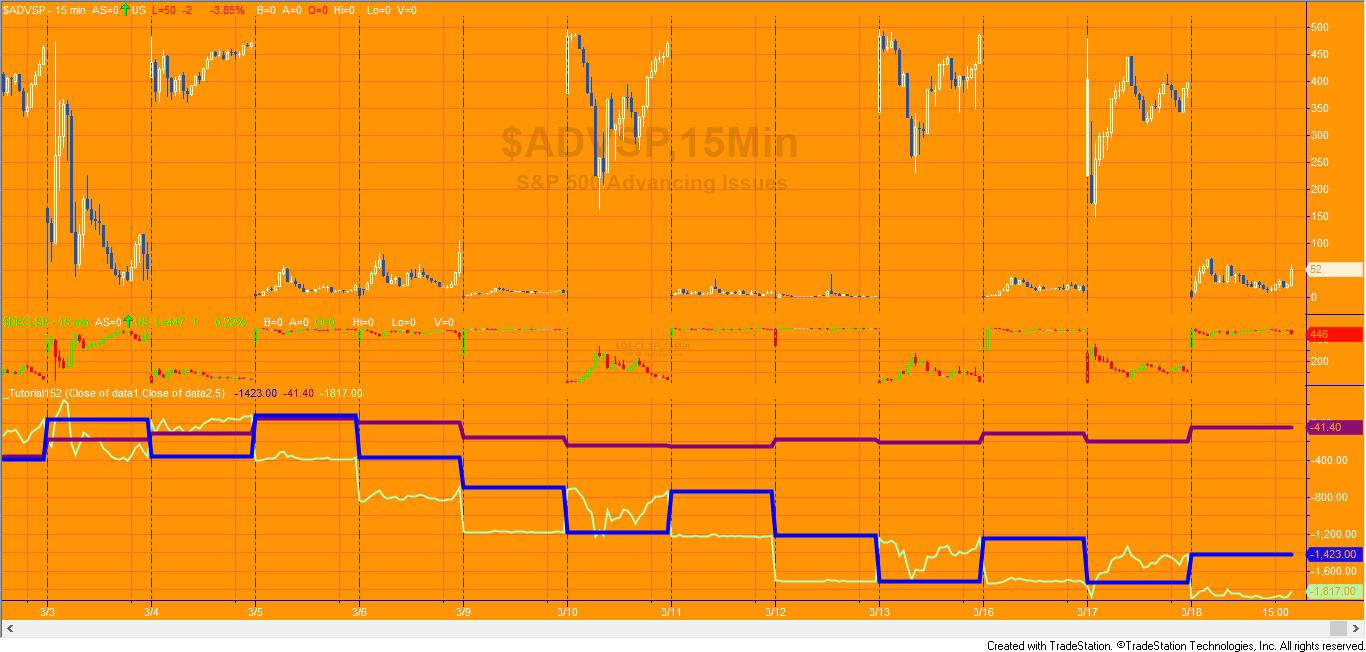
The advancing issues and declining issues line (AD line) is a technical indicator that can be used to indicate market sentiment. An AD Line indicator shows the difference between the number of advancing and declining stocks on a daily basis (depending on the symbols used). It could be used with S&P 500 advancing issues and declining issues data, symbols: $ADVSP and $DECLSP, for example. The value plotted is cumulative, with today’s value added or subtracted from the cumulative value the previous day.
Tutorial 152 calculates the cumulative value of the difference between two data streams plotted on a daily chart AND the same (or close, see below) values on minute interval charts.
The same calculation is done by the TradeStation AdvanceDeclineDiff function. The difference can be plotted on a daily chart using a simple program such as:
Inputs: AdvIssues( Close of data1 ), DecIssues( Close of data2 );
Vars: AD( 0 );
AD = AdvanceDeclineDiff( AdvIssues, DecIssues );
Plot1( AD, "AD" );
This works perfectly on a daily chart but if this program is applied to a minute based chart the results will be different because each bar on the minute chart shows a ‘snap shot’ of the advancing issues and declining issues data for that bar. In terms of the AD line, to match the daily data, the only relevant bar is the last bar of the day. This tutorial demonstrates how to plot the difference between advancing and declining issues on a minute based chart.
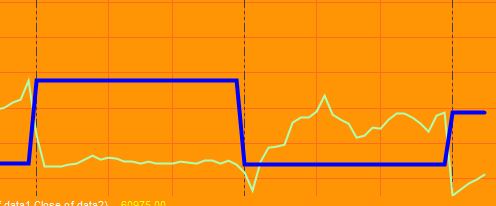
Two plots are made for for the Advance/Decline line on the minute interval chart. The first updates the value every time a new day begins. This is equivalent to the value plotted on the daily chart. The other plot updates throughout the day.
The tutorial also shows how to calculate the slope of the Advance/Decline line for both daily and minute charts.
To use this tutorial create a chart containing two data streams.
The _Tutorial152 program is available for immediate download for $34.95. The download is a TradeStation ELD file that includes the unprotected and commented program. This program will work in MultiCharts.
How the tutorial program works
In order to arrive at the same calculation as on the daily chart, the calculation of the Advance/Decline value on charts with a minute interval is made on the first bar of the day using the following code:
If D <> D[1] then // New day and 'minutes' type bar
Begin
CumulAdvDec = CumulAdvDec[1] + AdvIssues[1] - DecIssues[1]; // Calculate the cumulative advance/decline
End;
The program detects whether it is a daily or minute interval chart using the following code: If BarType = 2 then ….. // Daily chart or If BarType = 1 then // Minute interval chart
In order to calculate the interim values another variable the value is recalculated every tick uing similar code:
MinCumulAdvDec = CumulAdvDec + AdvIssues - DecIssues;
Bear in mind that CumulAdvDec stays the same throughout the day.
Calculating the slope
For the daily chart, the slope is calculated using a standard lines regression calculation. _Tutorial152 uses inline code in the program but it could have used the standard LinearRegression function.
On minute interval charts the calculation is not quite so easy. Say the length to calculate the slope is 5 (LRLength = 5). We cannot just look at the last 5 values of the Advance/Decline value on the minute interval chart because what we actually need is the last 5 daily values. In order to access this data easily _Tutorial 152 stores this data in an array.
Array: int DailyVals[]( 0 ); // Dynamic array that holds previous days values for minute interval charts
The calculations for daily and minute charts are compared in the following video.
Video summary of tutorial 152
Please email if you find any bugs, notice any errors, or have questions about the tutorial.
THESE INDICATORS, SHOW ME STUDIES, STRATEGIES AND OTHER PROGRAMS HAVE BEEN INCLUDED SOLELY FOR EDUCATIONAL PURPOSES.
TO THE BEST OF MARKPLEX CORPORATION’S KNOWLEDGE, ALL OF THE INFORMATION ON THIS PAGE IS CORRECT, AND IT IS PROVIDED IN THE HOPE THAT IT WILL BE USEFUL. HOWEVER, MARKPLEX CORPORATION ASSUMES NO LIABILITY FOR ANY DAMAGES, DIRECT OR OTHERWISE, RESULTING FROM THE USE OF THIS INFORMATION AND/OR PROGRAM(S) DESCRIBED, AND NO WARRANTY IS MADE REGARDING ITS ACCURACY OR COMPLETENESS. USE OF THIS INFORMATION AND/OR PROGRAMS DESCRIBED IS AT YOUR OWN RISK.
ANY EASYLANGUAGE OR POWERLANGUAGE TRADING STRATEGIES, SIGNALS, STUDIES, INDICATORS, SHOWME STUDIES, PAINTBAR STUDIES, PROBABILITYMAP STUDIES, ACTIVITYBAR STUDIES, FUNCTIONS (AND PARTS THEREOF) AND ASSOCIATED TECHNIQUES REFERRED TO, INCLUDED IN OR ATTACHED TO THIS TUTORIAL OR PROGRAM DESCRIPTION ARE EXAMPLES ONLY, AND HAVE BEEN INCLUDED SOLELY FOR EDUCATIONAL PURPOSES. MARKPLEX CORPORATION. DOES NOT RECOMMEND THAT YOU USE ANY SUCH TRADING STRATEGIES, SIGNALS, STUDIES, INDICATORS, SHOWME STUDIES, PAINTBAR STUDIES, PROBABILITYMAP STUDIES, ACTIVITYBAR STUDIES, FUNCTIONS (OR ANY PARTS THEREOF) OR TECHNIQUES. THE USE OF ANY SUCH TRADING STRATEGIES, SIGNALS, STUDIES, INDICATORS, SHOWME STUDIES, PAINTBAR STUDIES, PROBABILITYMAP STUDIES, ACTIVITYBAR STUDIES, FUNCTIONS AND TECHNIQUES DOES NOT GUARANTEE THAT YOU WILL MAKE PROFITS, INCREASE PROFITS, OR MINIMIZE LOSSES.