

A Gold Pass member asked for a tutorial about how to import data stored in Comma Separated Values file (CSV file) and use it to draw rectangles on a chart.
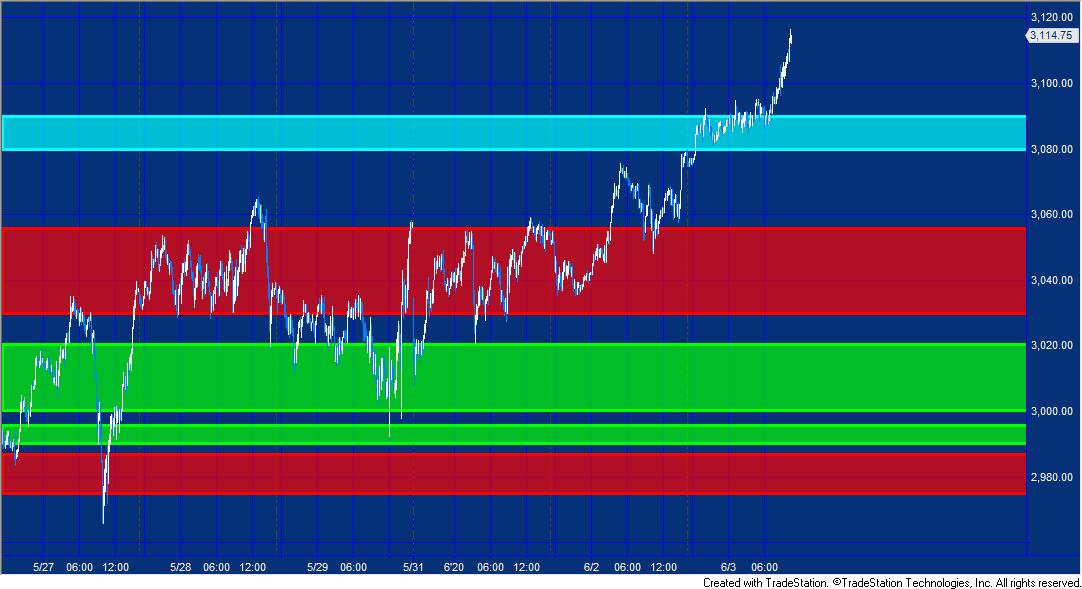
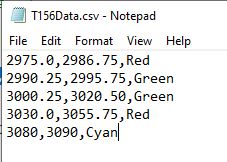 This tutorial envisages two scenarios. In the first, each line of the file contains two price levels and a color. The tutorial program processes the data and draws a box between the two price levels all the way across the chart. The color of the rectangle is set to the color contained on the same line as the levels.
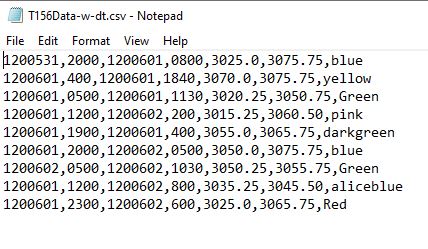
In the second scenario each line in the CSV file also contains and start date and time and an end date and time. Boxes are drawn between the two date/times and between the two levels.
The first part of the tutorial lines are drawn similar to the following:
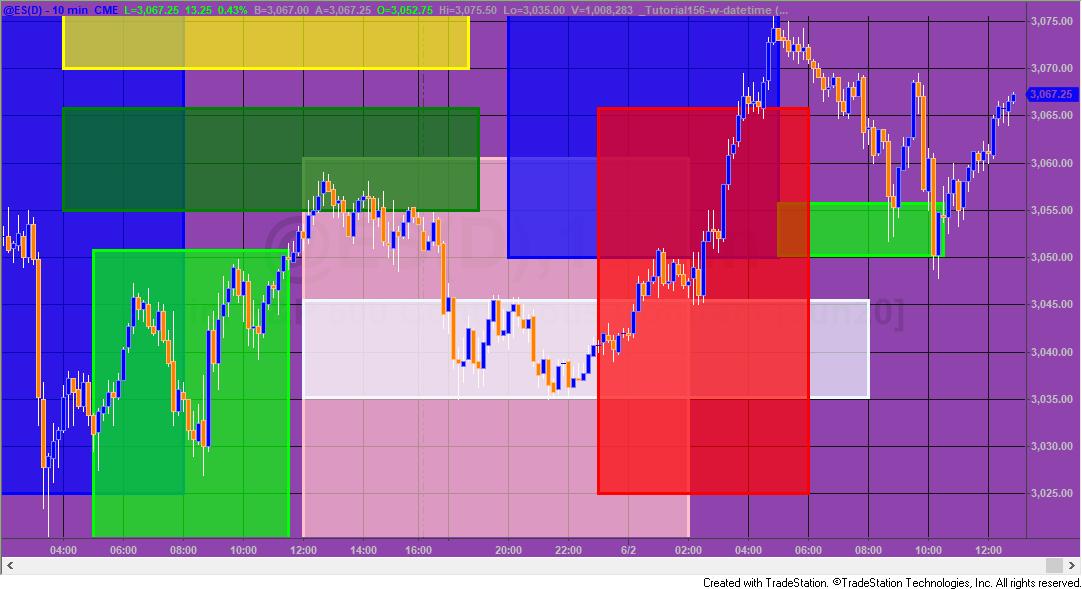
The following is an example of the output from the second part of the tutorial:
Programming notes
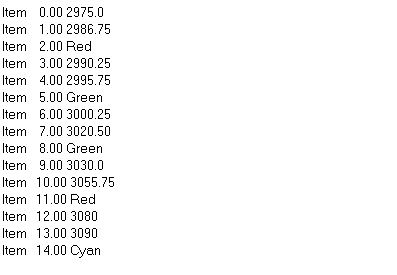
In both programs the EasyLanguage StreamReader is used to read in the data from the CSV file. In the first part of the program, a print out of the contents of the TokenList using the following code:
For Ctr = 0 to TL.Count - 1
Begin
Print( " Item ", Ctr," ", TL.Item[Ctr] );
End;
Results in the following:
// The syntax used in this tutorial
// In the first part of the tutorial BN point objects are used:
// The zero is the bar number. BNPoint uses an absolute bar index (zero-based)

ZoneBox = Rectangle.Create( BNPoint.Create( 0, Line1 ), BNPoint.Create( 0, Line2 ) );

// In the second example DT point objects are used

ZoneBox = Rectangle.Create( DTPoint.Create( dt1, Line1 ), DTPoint.Create( dt2, Line2 ) );
Tutorial 156 video
This unprotected and commented programs (i.e. the TradeStation EasyLanguage show-me studies):
- _Tutorial156 (the program developed in the first part of the tutorial)
- _Tutorial156-w-datetime (the program developed in the second part of the tutorial)
are available for immediate download for $24.95 by clicking the following ‘add to cart’ button where you may pay with a credit card or by using PayPal.
The program is compatible with versions TradeStation 9.5 and above, including 10. It is not compatible with MultiCharts.
THESE INDICATORS, SHOW ME STUDIES, STRATEGIES AND OTHER PROGRAMS HAVE BEEN INCLUDED SOLELY FOR EDUCATIONAL PURPOSES.
TO THE BEST OF MARKPLEX CORPORATION’S KNOWLEDGE, ALL OF THE INFORMATION ON THIS PAGE IS CORRECT, AND IT IS PROVIDED IN THE HOPE THAT IT WILL BE USEFUL. HOWEVER, MARKPLEX CORPORATION ASSUMES NO LIABILITY FOR ANY DAMAGES, DIRECT OR OTHERWISE, RESULTING FROM THE USE OF THIS INFORMATION AND/OR PROGRAM(S) DESCRIBED, AND NO WARRANTY IS MADE REGARDING ITS ACCURACY OR COMPLETENESS. USE OF THIS INFORMATION AND/OR PROGRAMS DESCRIBED IS AT YOUR OWN RISK.
ANY EASYLANGUAGE OR POWERLANGUAGE TRADING STRATEGIES, SIGNALS, STUDIES, INDICATORS, SHOWME STUDIES, PAINTBAR STUDIES, PROBABILITYMAP STUDIES, ACTIVITYBAR STUDIES, FUNCTIONS (AND PARTS THEREOF) AND ASSOCIATED TECHNIQUES REFERRED TO, INCLUDED IN OR ATTACHED TO THIS TUTORIAL OR PROGRAM DESCRIPTION ARE EXAMPLES ONLY, AND HAVE BEEN INCLUDED SOLELY FOR EDUCATIONAL PURPOSES. MARKPLEX CORPORATION. DOES NOT RECOMMEND THAT YOU USE ANY SUCH TRADING STRATEGIES, SIGNALS, STUDIES, INDICATORS, SHOWME STUDIES, PAINTBAR STUDIES, PROBABILITYMAP STUDIES, ACTIVITYBAR STUDIES, FUNCTIONS (OR ANY PARTS THEREOF) OR TECHNIQUES. THE USE OF ANY SUCH TRADING STRATEGIES, SIGNALS, STUDIES, INDICATORS, SHOWME STUDIES, PAINTBAR STUDIES, PROBABILITYMAP STUDIES, ACTIVITYBAR STUDIES, FUNCTIONS AND TECHNIQUES DOES NOT GUARANTEE THAT YOU WILL MAKE PROFITS, INCREASE PROFITS, OR MINIMIZE LOSSES.