

A Gold Pass member asked for a tutorial about how to screen a large number of symbols from a trading app.
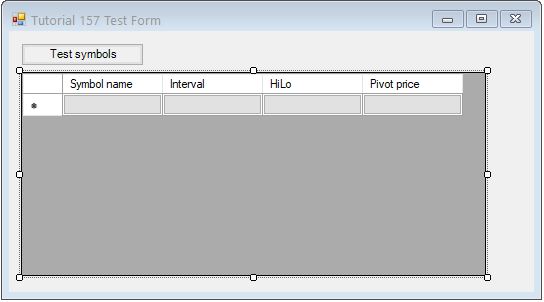
Tutorial 157 demonstrates how to create a program that does an analysis for a large number of symbols when a button is clicked. The program’s interface uses a form which contains a button and a data grid.
When the button is clicked the program imports a symbol list from the hard drive using a StreamReader object. See QuickTip37 for another example of this. A price series provider (PSP) is created for each symbol. A simple pivot algorithm is run for each PSP and if a low pivot is discovered the symbol name is added to a list in a data grid.
This technique could be useful if you were analyzing a large number of symbols but you only needed the analysis done at a specific time (e.g. a bar or two before market close.) Similar results could be obtained using RadarScreen or Scanner except that, ordinarily, RadarScreen would continue processing every bar even though the results would only be required at a certain time. This technique could also be run mid bar without waiting for the end of the bar.
A major advantage of the Radarscreen or Scanner approach is that both these applications can use regular indicators or show me studies. With the tutorial 157 approach, the functionality of an indicator or show-me study would need to be rewritten to work with a price series provider.
This can present programming challenges when you wish to use a cumulative value, for instance as with the exponential moving average calculation.
Programming notes
The tutorial program contains examples of the use of:
- Forms (including a button and data grid)
- StreamReader
- TokenList
- Dictionary
- Price series providers
- Price series provider loaded update event
Designing the form
In this tutorial the form was created using the TradeStation development environment. After the Trading App has been created, right clicking the program space gives an option to ‘Add form.’ The button and the data grid were added to the form by selecting double clicking ‘Toolbox’ and then double clicking Button and DataGridView.
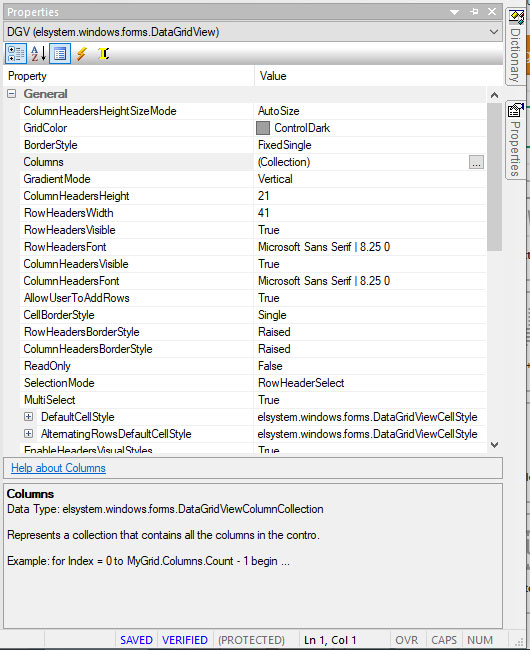
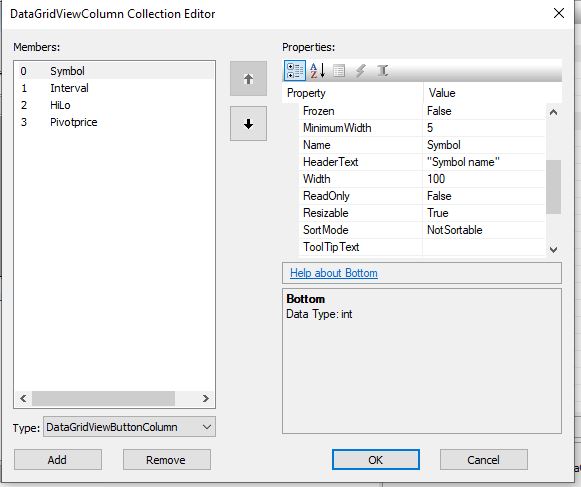
Once created the Button and DataGridView objects can be modified by selecting them and then clicking the Properties button (on the right hand side of the screen), as in the following images.
Tutorial 157 video
This unprotected and commented program (i.e. the TradeStation EasyLanguage Trading App):
- _Tutorial157
is available for immediate download for $24.95 by clicking the following ‘add to cart’ button where you may pay with a credit card or by using PayPal.
The program is compatible with versions TradeStation 9.5 and above, including 10. It is not compatible with MultiCharts.
Gold Pass area
If you are a Gold Pass member you can download the tutorial ELD file below, please make sure that you are logged in with your Gold Pass user name and password.
![]() This content is for members only.
This content is for members only.
THE TRADING APPS, INDICATORS, SHOW ME STUDIES, STRATEGIES AND OTHER PROGRAMS HAVE BEEN INCLUDED SOLELY FOR EDUCATIONAL PURPOSES.
TO THE BEST OF MARKPLEX CORPORATION’S KNOWLEDGE, ALL OF THE INFORMATION ON THIS PAGE IS CORRECT, AND IT IS PROVIDED IN THE HOPE THAT IT WILL BE USEFUL. HOWEVER, MARKPLEX CORPORATION ASSUMES NO LIABILITY FOR ANY DAMAGES, DIRECT OR OTHERWISE, RESULTING FROM THE USE OF THIS INFORMATION AND/OR PROGRAM(S) DESCRIBED, AND NO WARRANTY IS MADE REGARDING ITS ACCURACY OR COMPLETENESS. USE OF THIS INFORMATION AND/OR PROGRAMS DESCRIBED IS AT YOUR OWN RISK.
ANY EASYLANGUAGE OR POWERLANGUAGE TRADING STRATEGIES, TRADING APPS, SIGNALS, STUDIES, INDICATORS, SHOWME STUDIES, PAINTBAR STUDIES, PROBABILITYMAP STUDIES, ACTIVITYBAR STUDIES, FUNCTIONS (AND PARTS THEREOF) AND ASSOCIATED TECHNIQUES REFERRED TO, INCLUDED IN OR ATTACHED TO THIS TUTORIAL OR PROGRAM DESCRIPTION ARE EXAMPLES ONLY, AND HAVE BEEN INCLUDED SOLELY FOR EDUCATIONAL PURPOSES. MARKPLEX CORPORATION. DOES NOT RECOMMEND THAT YOU USE ANY SUCH TRADING STRATEGIES, SIGNALS, STUDIES, INDICATORS, SHOWME STUDIES, PAINTBAR STUDIES, PROBABILITYMAP STUDIES, ACTIVITYBAR STUDIES, FUNCTIONS (OR ANY PARTS THEREOF) OR TECHNIQUES. THE USE OF ANY SUCH TRADING STRATEGIES, SIGNALS, STUDIES, INDICATORS, SHOWME STUDIES, PAINTBAR STUDIES, PROBABILITYMAP STUDIES, ACTIVITYBAR STUDIES, FUNCTIONS AND TECHNIQUES DOES NOT GUARANTEE THAT YOU WILL MAKE PROFITS, INCREASE PROFITS, OR MINIMIZE LOSSES.