
Welcome to tutorial 16 in this series of tutorials designed to demonstrate and explain TradeStation EasyLanguage programming concepts. The idea behind the series is that if you learn the TradeStation EasyLanguage yourself, you will have a skill that will enable you to program and try out trading ideas whenever you want.
As always, the purpose of this tutorial is to demonstrate the programming techniques rather than to create a tradable indicator. See the disclaimer at the end of this page. I am using TradeStation version 8.1 to create this tutorial.
You may wish to develop a strategy where you look for one signal – and then wait for a confirming signal. This confirming signal may happen on the same bar as the original signal. On the other hand, it may occur a few bars later – and this may be acceptable for your trading strategy. An example of this would be a strategy where we look for a candlestick signal and then wait for a stochastic crossover as a confirmation. Obviously there will be a stochastic crossover at some point in the future and so we need to limit the number of bars after the candlestick pattern has occurred for the crossover to trigger a trade.
This step-by-step tutorial will guide you through several techniques including: using EasyLanguage’s built in candlestick pattern functions, drawing a character(s) on the chart when a candlestick pattern has occurred, using EasyLanguage StopLoss and ProfitTarget functions, finding stochastic crossovers and looking for confirmation signals a user-defined number of bars after an initial ‘warning signal.’ I am using an initial candlestick signal followed by a confirming stochastic signal in this tutorial, however it could be modified to use a different pair of indicators. I have applied this strategy to a daily EURUSD chart. It could also be applied to intraday charts.
The following chart shows an entry signal resulting from this strategy.
You may follow the tutorial and copy and type the program to try it out. If you would prefer to cut down your typing, you may, for nominal fee of $39.95, download the program by click the ‘add to cart button.’ After payment, your software is available for immediate download.
Step 1
To start, create a new strategy (press CTR-N, select the EasyLanguage tab, click on strategy and delete all the initial contents of the strategy). The first task to to apply some EasyLanguage candlestick functions to show candlestick patterns. TradeStation provide many candlestick pattern functions. To see them all, try typing “candlestick” into the TradeStation user guide. We are going to use 3 patterns in this tutorial: bullish/bearish Harami, bullish/bearish engulfing and 3 White Solidiers/3 Black crows.
Enter the following (ignore the color blocks – I added these for clarification):
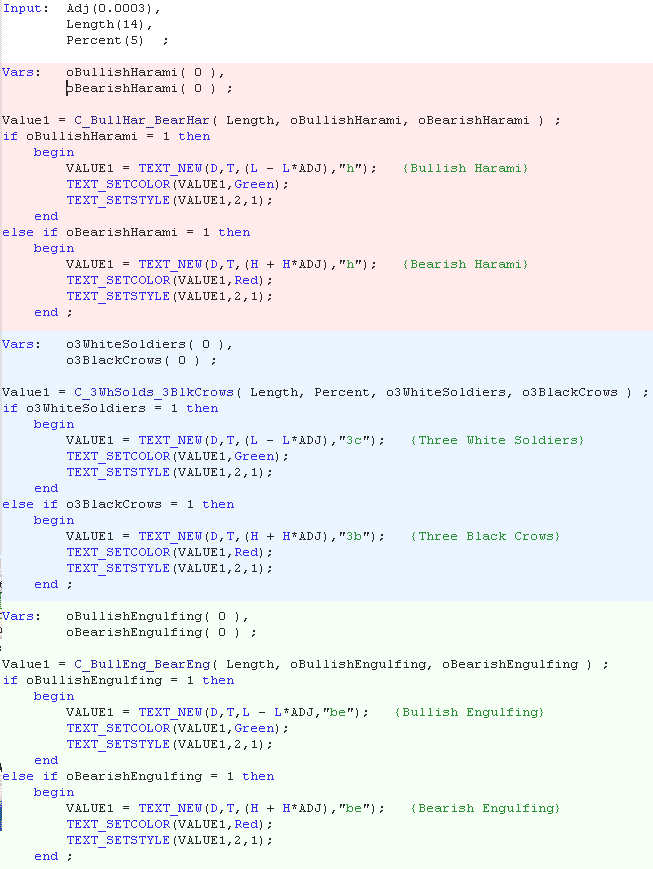
I separated the different functions’ variables so that they appear just above the function call. Remember that with functions the outputs look a little like inputs. For example, with the function: C_3WhSolds_3BlkCrows( Length, Percent, o3WhiteSoldiers, o3BlackCrows ) the outputs are actually o3WhiteSoldiers and o3BlackCrows. If either of these outputs is equal to 1 it means that the candlestick pattern has occured. If it has we draw a letter on the chart at the corresponding bar, for example:
if o3WhiteSoldiers = 1 then
begin
VALUE1 = TEXT_NEW(D,T,(L – L*ADJ),”3c”); {Three White Soldiers}
TEXT_SETCOLOR(VALUE1,Green);
TEXT_SETSTYLE(VALUE1,2,1);
end;
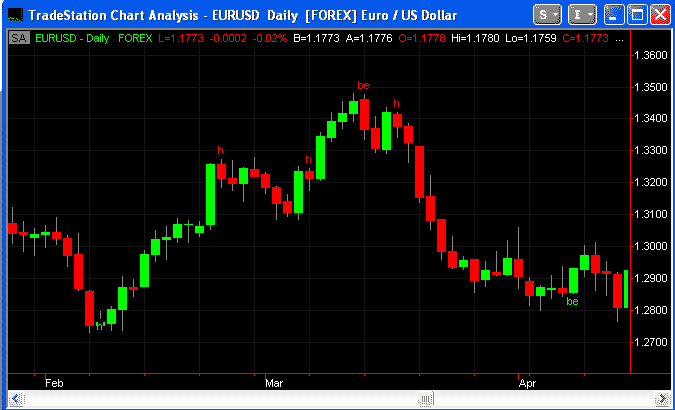
The following shows the result of applying this strategy to a chart. Notice that I placed the characters above the high of the bar by adding an adjustment input (H + H*ADJ) and below of the lows by subtracting an adjustment (L – L*ADJ).
Step 2
Once the candlestick pattern has occurred we need to start counting bars so that we can test that the confirming pattern has occurred within a certain number of bars. Make the following modifications to your existing program.
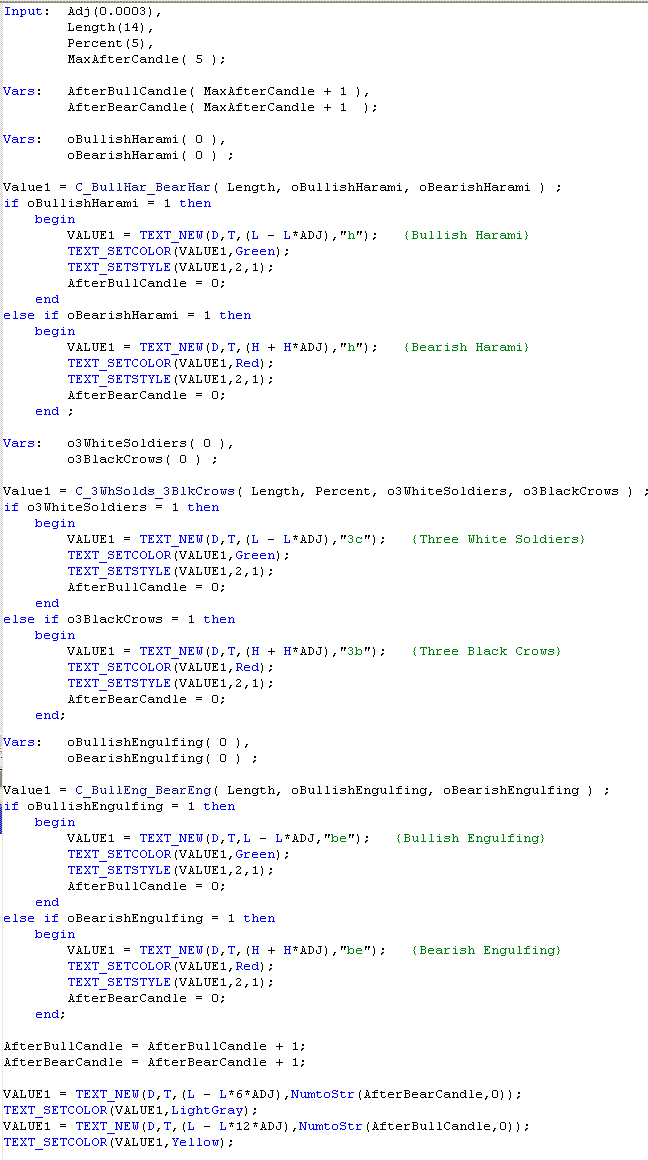
With these changes we increment 2 variables: AfterBullCandle and AfterBearCandle every bar. When a candlestick pattern is detected the appropriate counter is reset to zero.
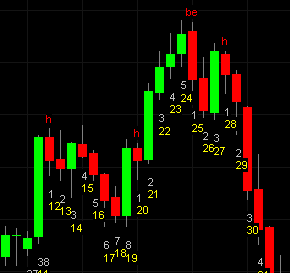
The input value MaxAfterCandle is the number of bars after a candlestick signal that the stochastic crossover will still trigger a signal. I have printed the AfterBearCandle and AfterBullCandle counters on the chart. These will be removed in the final version, but are useful in making sure that the program is performing as expected. This is a very useful technique to use as you develop programs. Notice that I set the initial values of AfterBearCandle and AfterBullCandle to be equal to MaxAfterCandle + 1. This is to make sure that we don’t get a false trigger at the start of the chart – even though a candlestick pattern has not occurred.
Step 3
The next step is to add the stochastic function to the program – together with the necessary inputs and variables. Make the following modifications to your program:
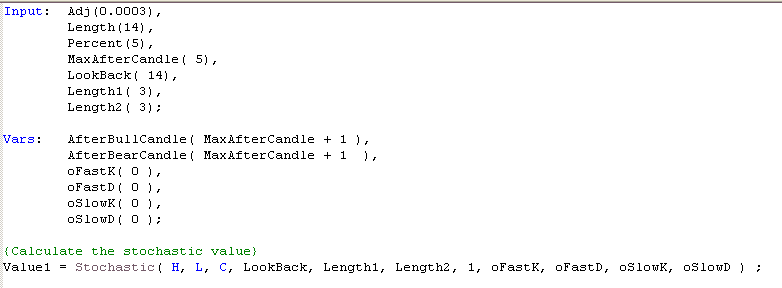
This adds the stochastic function but does not do anything with it. In the next step, we will look for stochastic crossovers and also add a stop loss and profit target function.
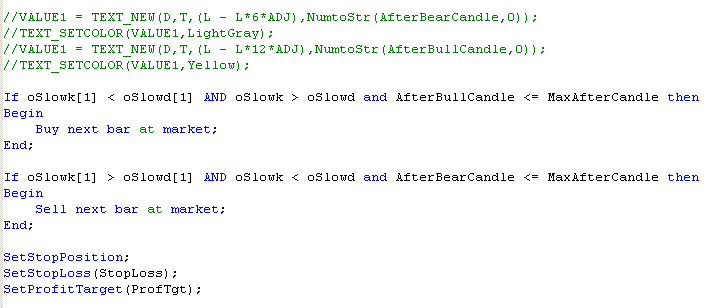
Step 4
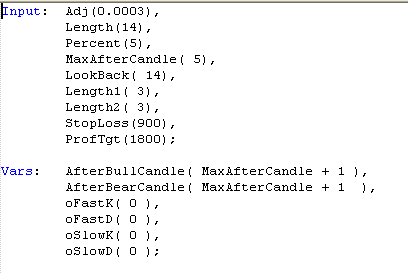
and add the following at the bottom of the strategy. Notice that the lines that ‘printed’ the bar numbers have been “commented out” by putting a “//” in front of the line. The next lines test for a stochastic crossover together with a count less than the MaxAfterCandle number of bars. To understand how the SetStopLoss and SetProfitTarget work, enter them into TradeStation and right click the words and click on “definition of …” .
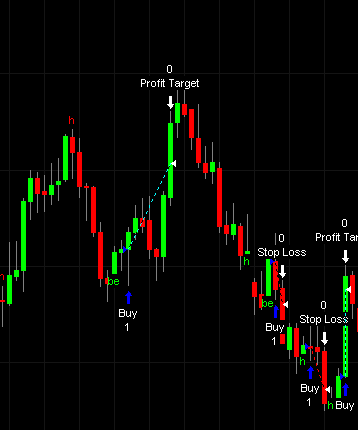
After making these changes and verifying the program (press F3 while in the program entry windows). Apply to a chart (if you have not already done so), and view the results. Here is an example of what you might expect.
To aid your understanding of what is going on, you could add a stochastic indicator to the chart. CAUTION: make sure you use the same parameters that you are using in the strategy, or you will confuse yourself as to why certain trades happen at certain times.
Strategy property controls can be used to determine some aspects of how the strategy works and is backtested.
You may, for nominal fee of $39.95, download the program by click the ‘add to cart button.’ After payment, your software is available for immediate download.
TO THE BEST OF MARKPLEX CORPORATION’S KNOWLEDGE, ALL OF THE INFORMATION ON THIS PAGE IS CORRECT, AND IT IS PROVIDED IN THE HOPE THAT IT WILL BE USEFUL. HOWEVER, MARKPLEX CORPORATION ASSUMES NO LIABILITY FOR ANY DAMAGES, DIRECT OR OTHERWISE, RESULTING FROM THE USE OF THIS INFORMATION AND/OR PROGRAM(S) DESCRIBED, AND NO WARRANTY IS MADE REGARDING ITS ACCURACY OR COMPLETENESS. USE OF THIS INFORMATION AND/OR PROGRAMS DESCRIBED IS AT YOUR OWN RISK.
ANY EASYLANGUAGE OR POWERLANGUAGE TRADING STRATEGIES, SIGNALS, STUDIES, INDICATORS, SHOWME STUDIES, PAINTBAR STUDIES, PROBABILITYMAP STUDIES, ACTIVITYBAR STUDIES, FUNCTIONS (AND PARTS THEREOF) AND ASSOCIATED TECHNIQUES REFERRED TO, INCLUDED IN OR ATTACHED TO THIS TUTORIAL OR PROGRAM DESCRIPTION ARE EXAMPLES ONLY, AND HAVE BEEN INCLUDED SOLELY FOR EDUCATIONAL PURPOSES. MARKPLEX CORPORATION. DOES NOT RECOMMEND THAT YOU USE ANY SUCH TRADING STRATEGIES, SIGNALS, STUDIES, INDICATORS, SHOWME STUDIES, PAINTBAR STUDIES, PROBABILITYMAP STUDIES, ACTIVITYBAR STUDIES, FUNCTIONS (OR ANY PARTS THEREOF) OR TECHNIQUES. THE USE OF ANY SUCH TRADING STRATEGIES, SIGNALS, STUDIES, INDICATORS, SHOWME STUDIES, PAINTBAR STUDIES, PROBABILITYMAP STUDIES, ACTIVITYBAR STUDIES, FUNCTIONS AND TECHNIQUES DOES NOT GUARANTEE THAT YOU WILL MAKE PROFITS, INCREASE PROFITS, OR MINIMIZE LOSSES.
If you see any errors in this tutorial – or I have not made something clear, please let me know. You can e-mail me at: tutorials@markplex.com. Also, let me know if you have any ideas for new tutorials.