

Tutorial 160 demonstrates how to find the average volume of the current bar and a user input number of previous occurrences with the same time value.
For each bar the tutorial stores the volume in a vector associated with a key based on the bar time and stored in a dictionary. If the user input: Length is set to 4 (i.e. 4 days back), The volumes of the previous three bars with the same time were already stored in the vector when the tutorial program encountered them.
The sum of these four values is then averaged and plotted for the current bar.
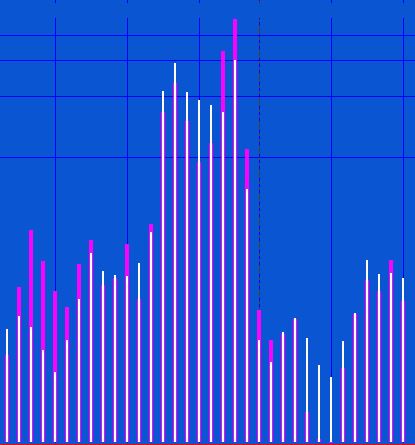
The following image demonstrates. I have added arrows and text in drawing software. If Length is set to 4, the average volume by time for the 12:00 marked A will be equal to (Volume of Bar A + Volume of Bar B + Volume of Bar C + Volume of Bar D ) divided by Length, i.e. in this case 4.

The program uses the Dictionary and Vector classes. For each different bar time on the chart a ‘key’ is stored.
For a new key a vector is created and stored as the value associated with the key. As the same key is encountered again (i.e the same time the following day) the volume is added to the vector. When the vector exceeds Length the element at the zero position (i.e. the oldest) is deleted.
The tutorial is designed to be used with Intraday, time-based bars (e.g. 1 min, 10 min, 60min etc).
N.B. In TradeStation the keywords associated with volume vary their function depending on context. For example, for electronically traded futures contracts (assuming “Trade Vol” selected for the symbol) the keywords mean the following:
- Volume: volume traded on Up Ticks
- Ticks: Total Volume
- UpTicks: Volume traded on Up Ticks
- DownTicks: Volume traded on Down Ticks
- OpenInt: Volume traded on Down Ticks
This tutorial uses the keyword: V or Volume
Technical notes
Tutorial 160 gives an example of storing vectors within a dictionary. By using vectors to store a fixed number of volumes makes it easy to add a new values and delete the oldest value.

Download the tutorial 160 program
If you want to save yourself some typing the tutorial 160 program is available for immediate download.
The tutorial program is available for immediate download for $39.95 by clicking the following button. You can pay using PayPal or credit card. The program works with TradeStation 9.5, and 10 but is not compatible with MultiCharts.
The program is unprotected, in other words, you will be able to see the program code.
Video explanation of tutorial 160

TO THE BEST OF MARKPLEX CORPORATION’S KNOWLEDGE, ALL OF THE INFORMATION ON THIS PAGE IS CORRECT, AND IT IS PROVIDED IN THE HOPE THAT IT WILL BE USEFUL. HOWEVER, MARKPLEX CORPORATION ASSUMES NO LIABILITY FOR ANY DAMAGES, DIRECT OR OTHERWISE, RESULTING FROM THE USE OF THIS INFORMATION AND/OR PROGRAM(S) DESCRIBED, AND NO WARRANTY IS MADE REGARDING ITS ACCURACY OR COMPLETENESS. USE OF THIS INFORMATION AND/OR PROGRAMS DESCRIBED IS AT YOUR OWN RISK.
ANY EASYLANGUAGE OR POWERLANGUAGE TRADING STRATEGIES, SIGNALS, STUDIES, INDICATORS, SHOWME STUDIES, PAINTBAR STUDIES, PROBABILITYMAP STUDIES, ACTIVITYBAR STUDIES, FUNCTIONS (AND PARTS THEREOF) AND ASSOCIATED TECHNIQUES REFERRED TO, INCLUDED IN OR ATTACHED TO THIS TUTORIAL OR PROGRAM DESCRIPTION ARE EXAMPLES ONLY, AND HAVE BEEN INCLUDED SOLELY FOR EDUCATIONAL PURPOSES. MARKPLEX CORPORATION. DOES NOT RECOMMEND THAT YOU USE ANY SUCH TRADING STRATEGIES, SIGNALS, STUDIES, INDICATORS, SHOWME STUDIES, PAINTBAR STUDIES, PROBABILITYMAP STUDIES, ACTIVITYBAR STUDIES, FUNCTIONS (OR ANY PARTS THEREOF) OR TECHNIQUES. THE USE OF ANY SUCH TRADING STRATEGIES, SIGNALS, STUDIES, INDICATORS, SHOWME STUDIES, PAINTBAR STUDIES, PROBABILITYMAP STUDIES, ACTIVITYBAR STUDIES, FUNCTIONS AND TECHNIQUES DOES NOT GUARANTEE THAT YOU WILL MAKE PROFITS, INCREASE PROFITS, OR MINIMIZE LOSSES.