

Tutorial 161 demonstrates the use of the Global Dictionary. In this tutorial the values of four moving averages from one chart are stored in a GlobalDictionary using a sender program (_Tutorial161-Send) and then they are read by a receiver program (_Tutorial161-Receive).
In the first example the values are initially stored in a vector, in the other they are stored in a comma delimited list. The values are read from the Global Dictionary using another program (_Tutorial161-Receive) and plotted on the receiving chart.
The syntax for creating a global dictionary varies depending on how the global dictionary will be used. To share values within same window type (e.g. between two charts) when compatibility mode (i.e. not using multi-core) is switched on, this syntax may be used:
myGD = GlobalDictionary.create( );
To share values beyond the same window type (e.g. between a chart and RadarScreen) OR between two charts when multi-core charting is enabled.
myGD = GlobalDictionary.create( True, "share_name" );
The Share parameter value of TRUE or FALSE controls whether inter-process sharing is enabled or disabled.
FIRST EXAMPLE – COMPATIBILITY MODE. SHARING BETWEEN CHARTS
In the first example the global dictionary is created using the
myGD = GlobalDictionary.create( );
syntax. TradeStation is being used in compatibility mode (i.e. multi-core charting is NOT enabled.)
For each bar on the sending chart, the four values of the averages are stored in a vector and the vector is added to the dictionary using NumToStr( ( Date + Time / 10000 ), 4 ) as the key.
Time is formatted like 1550, i.e the first two digits are the hour in 24 hours format, and the second two digits are the minutes.
Combining the values using ( Date + Time / 10000 ) results in 1201007.1550 which is then converted to a string saved to 4 decimal places.
On the receiving chart, for each bar the program (_Tutorial161-Receive) checks to see if there is anything stored for the current bar using the key: NumToStr( ( D + T / 10000 ), 4 ). If that key exists the associated value is copied into a vector. The values for the averages are read form the vector and plotted on another chart.
SECOND EXAMPLE – MULTI-CORE CHARTING IS ENABLED. SHARING BETWEEN CHARTS AND A DIFFERENT WINDOW TYPE
In the second example the global dictionary is created using the
myGD = GlobalDictionary.create( True, "share_name" );
syntax. TradeStation is being used with multi-core charting enabled.
1. USING A VECTOR
As in the first example, the values are stored in a vector.
Storing a vector (or dictionary) as the “value” in a GlobalDictionary key/value pair will work provided the vector or dictionary values are not objects other than DateTime or dictionaries or vectors that satisfy the same restriction to any level. Values must be “serializable” to string format.
2. USING A COMMA DELIMITED LIST
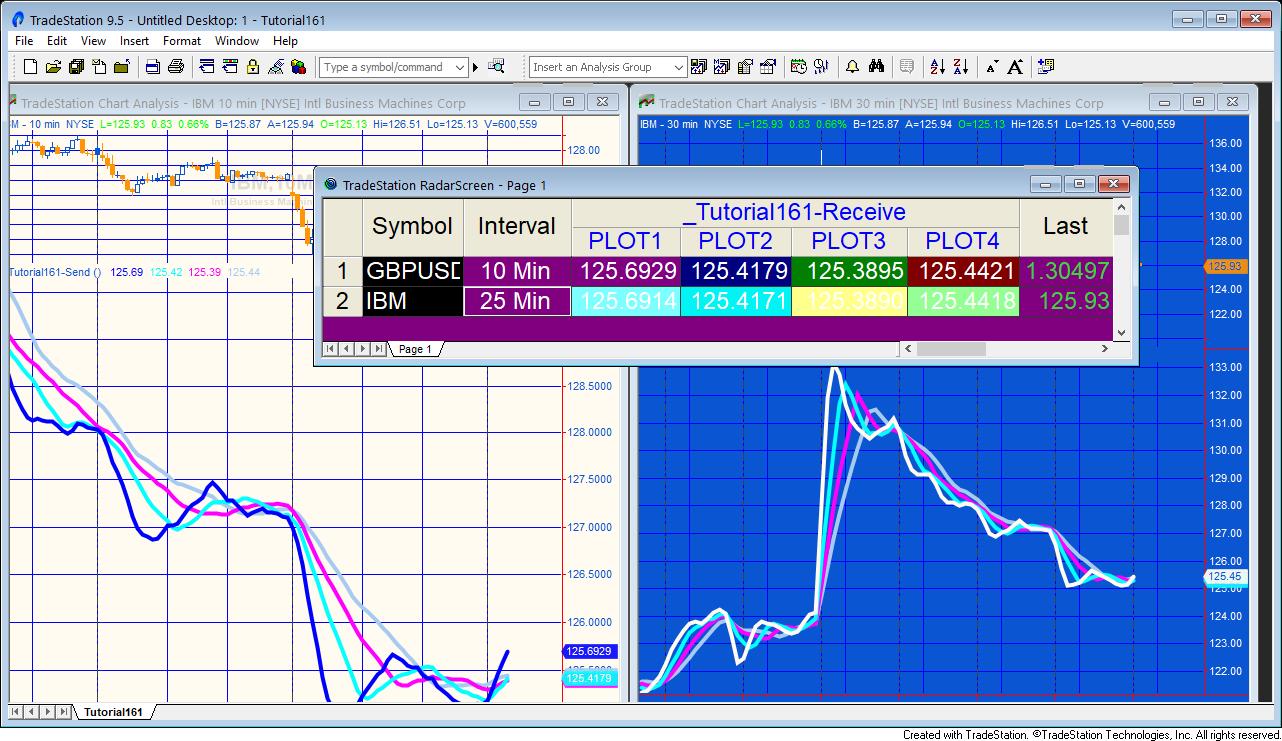 For each bar on the sending chart, the four values of the averages are stored in a comma delimited list and the resulting string is added to the dictionary using NumToStr( ( Date + Time / 10000 ), 4 ) as the key.
On the receiving chart, for each bar the program (_Tutorial161-Receive) checks to see if there is anything stored for the current bar using the key: NumToStr( ( D + T / 10000 ), 4 ). If that key exists the associated value is copied into a TokenList. The values for the averages are read form the TokenList and plotted on another chart or read by RadarScreen.
For the tutorial to successfully share data between charts there must be bars on both the sending and receiving charts that share the same NumToStr( ( D + T / 10000 ), 4 ) values.
- Use of Global Dictionary
- Compatibility mode
- Storing vectors, strings and integers in the global dictionary
- Issues surrounding sharing across different types of window (e.g. chart and RadarScreen)
- Using TokenLists
- Reloading the receiving chart when data has been loaded on the sending chart
Tutorial video
Download the tutorial 161 tutorial programs (_Tutorial161-Send and _Tutorial161-Receive)
If you want to save yourself some typing the tutorial 161 programs are available for immediate download.
The tutorial programs are available for immediate download for $19.95 by clicking the following button. You can pay using PayPal or credit card. The program works with TradeStation 9.5, and TradeStation 10 but is not compatible with MultiCharts.
The program is unprotected, in other words, you will be able to see the program code.
THE TRADING APPS, INDICATORS, SHOW ME STUDIES, STRATEGIES AND OTHER PROGRAMS HAVE BEEN INCLUDED SOLELY FOR EDUCATIONAL PURPOSES.
TO THE BEST OF MARKPLEX CORPORATION’S KNOWLEDGE, ALL OF THE INFORMATION ON THIS PAGE IS CORRECT, AND IT IS PROVIDED IN THE HOPE THAT IT WILL BE USEFUL. HOWEVER, MARKPLEX CORPORATION ASSUMES NO LIABILITY FOR ANY DAMAGES, DIRECT OR OTHERWISE, RESULTING FROM THE USE OF THIS INFORMATION AND/OR PROGRAM(S) DESCRIBED, AND NO WARRANTY IS MADE REGARDING ITS ACCURACY OR COMPLETENESS. USE OF THIS INFORMATION AND/OR PROGRAMS DESCRIBED IS AT YOUR OWN RISK.
ANY EASYLANGUAGE OR POWERLANGUAGE TRADING STRATEGIES, TRADING APPS, SIGNALS, STUDIES, INDICATORS, SHOWME STUDIES, PAINTBAR STUDIES, PROBABILITYMAP STUDIES, ACTIVITYBAR STUDIES, FUNCTIONS (AND PARTS THEREOF) AND ASSOCIATED TECHNIQUES REFERRED TO, INCLUDED IN OR ATTACHED TO THIS TUTORIAL OR PROGRAM DESCRIPTION ARE EXAMPLES ONLY, AND HAVE BEEN INCLUDED SOLELY FOR EDUCATIONAL PURPOSES. MARKPLEX CORPORATION. DOES NOT RECOMMEND THAT YOU USE ANY SUCH TRADING STRATEGIES, SIGNALS, STUDIES, INDICATORS, SHOWME STUDIES, PAINTBAR STUDIES, PROBABILITYMAP STUDIES, ACTIVITYBAR STUDIES, FUNCTIONS (OR ANY PARTS THEREOF) OR TECHNIQUES. THE USE OF ANY SUCH TRADING STRATEGIES, SIGNALS, STUDIES, INDICATORS, SHOWME STUDIES, PAINTBAR STUDIES, PROBABILITYMAP STUDIES, ACTIVITYBAR STUDIES, FUNCTIONS AND TECHNIQUES DOES NOT GUARANTEE THAT YOU WILL MAKE PROFITS, INCREASE PROFITS, OR MINIMIZE LOSSES.