

_Tutorial168 is designed for RadarScreen using price series providers (PSPs) to calculate the moving average for monthly, weekly, daily and minute bars. The moving averages are compared with the closing price of of the current PSP bar. If the close is higher than the moving average of that interval a variable (Score) is incremented by one. If it is less then the variable is decremented by one.
The tutorial demonstrates how to create a method that can be called to create several PSPs. The method has two inputs: the first input is the interval type is a string (e.g. “Monthly”, “Weekly”) etc. The second
input is the interval span expressed as an integer. This input only applies to minute bars. The method outputs a PSP. Update and a state changed events are created for each PSP.
The price series providers are loaded once when the indicator is first applied or reapplied to the chart. In this example the indicator is applied to a 5 minute bar. The calculation of the ‘score’ is done at the end of each bar. The plots are also updated at the end of each bar. For each of the four bar intervals the close of the PSP bar and the moving average are plotted. The ‘score’ is also plotted.
Note that a PSP does not reveal any historical data after the datetime of the current bar being processed, in this case the 5 minute bar. No events are raised for historic data.
The tutorial program works with TradeStation versions 9.5 and 10.
See other examples of using PSPs here.
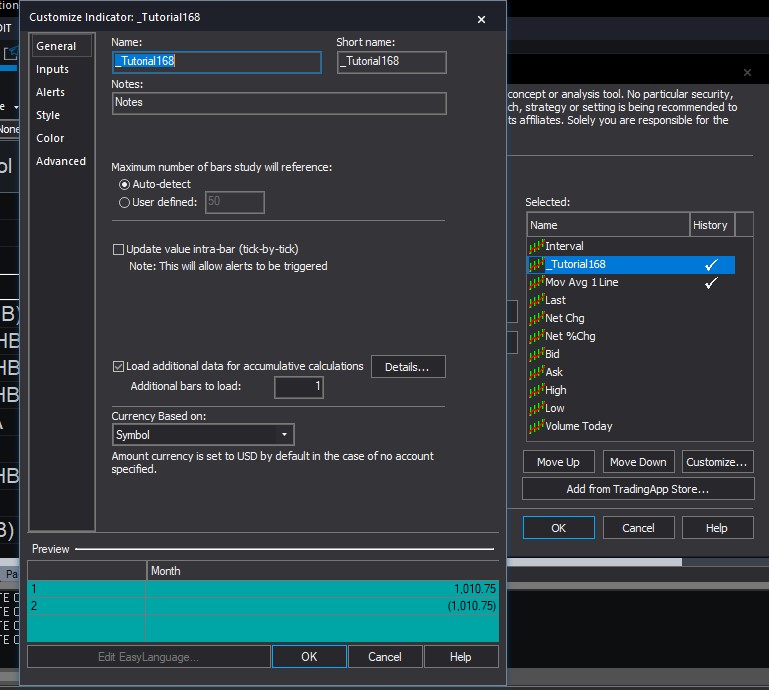 In this example the ‘Update value intrabar’ is not selected.
Technical lessons
The programming techniques discussed include:
- Using multiple price series providers
- Creating a double input method that outputs a price series provider
- Using the update and state change events
- The switch statement
Video walk through of the tutorial program
Download the tutorial 168 TradeStation EasyLanguage indicator
If you want to save yourself some typing, the tutorial 168 program is available for immediate download for $29.95 by clicking the following button. You can pay using PayPal or credit card. The program works with TradeStation 9.5, and TradeStation 10 but, unfortunately, is not compatible with MultiCharts.
The download consists of _Tutorial168 (the program developed in the tutorial).
The indicator is not protected, in other words, you will be able to see, modify and experiment with the tutorial’s code as well as use it as a template for your own projects.
Gold Pass area
THE TRADING APPS, INDICATORS, SHOW ME STUDIES, STRATEGIES AND OTHER PROGRAMS HAVE BEEN INCLUDED SOLELY FOR EDUCATIONAL PURPOSES.
TO THE BEST OF MARKPLEX CORPORATION’S KNOWLEDGE, ALL OF THE INFORMATION ON THIS PAGE IS CORRECT, AND IT IS PROVIDED IN THE HOPE THAT IT WILL BE USEFUL. HOWEVER, MARKPLEX CORPORATION ASSUMES NO LIABILITY FOR ANY DAMAGES, DIRECT OR OTHERWISE, RESULTING FROM THE USE OF THIS INFORMATION AND/OR PROGRAM(S) DESCRIBED, AND NO WARRANTY IS MADE REGARDING ITS ACCURACY OR COMPLETENESS. USE OF THIS INFORMATION AND/OR PROGRAMS DESCRIBED IS AT YOUR OWN RISK.
ANY EASYLANGUAGE OR POWERLANGUAGE TRADING STRATEGIES, TRADING APPS, SIGNALS, STUDIES, INDICATORS, SHOWME STUDIES, PAINTBAR STUDIES, PROBABILITYMAP STUDIES, ACTIVITYBAR STUDIES, FUNCTIONS (AND PARTS THEREOF) AND ASSOCIATED TECHNIQUES REFERRED TO, INCLUDED IN OR ATTACHED TO THIS TUTORIAL OR PROGRAM DESCRIPTION ARE EXAMPLES ONLY, AND HAVE BEEN INCLUDED SOLELY FOR EDUCATIONAL PURPOSES. MARKPLEX CORPORATION. DOES NOT RECOMMEND THAT YOU USE ANY SUCH TRADING STRATEGIES, SIGNALS, STUDIES, INDICATORS, SHOWME STUDIES, PAINTBAR STUDIES, PROBABILITYMAP STUDIES, ACTIVITYBAR STUDIES, FUNCTIONS (OR ANY PARTS THEREOF) OR TECHNIQUES. THE USE OF ANY SUCH TRADING STRATEGIES, SIGNALS, STUDIES, INDICATORS, SHOWME STUDIES, PAINTBAR STUDIES, PROBABILITYMAP STUDIES, ACTIVITYBAR STUDIES, FUNCTIONS AND TECHNIQUES DOES NOT GUARANTEE THAT YOU WILL MAKE PROFITS, INCREASE PROFITS, OR MINIMIZE LOSSES.