

Tutorial 174 demonstrates how to write Markplex’s version of the Centered Moving Average (CMA) using TradeStation EasyLanguage. A centered moving average is placed at the center of the range rather than the end of it. This positions the moving average values at their central positions in time and is easy to accomplish by using EasyLanguage’s displace capability.
A disadvantage of the CMA is that because the values are displaced there are a number of bars at the end of the chart where there are not a sufficient number of future bars to calculate the average, by definition.
Estimating the CMA for ‘missing’ bars
This tutorial demonstrates one approach to estimating the average for the last bars by replacing “missing” bars with the Close of the last bar and then re-calculating and re-plotting the last few bars whenever the close is updated.

Estimates are made for the CMA for last few bars on the chart. These bars are plotted in a different color, by default. In the example below the displaced plot is plotted in light magenta and the estimated bars are plotted in green. The earliest bar of the estimate remains on the chart after a new bar develops (hence the green plot is longer than 5 bars – the length in this example was 11.)

Odd or even number of bars?
When Length is an even number (i.e. there is a no bar that is in the center of the length) the plot is plotted one bar later. For example, if Length is equal to 10 and it is the last bar on the chart, the plot for the center moving average is made 4 bars ago and 4 estimated values are calculated and plotted.

In the case when the length is an odd number then the middle bar has an equal number of bars on either side. For example, in this example, Length is set to 11. The middle bar is number 5 (remember that the bars are counted from zero.:
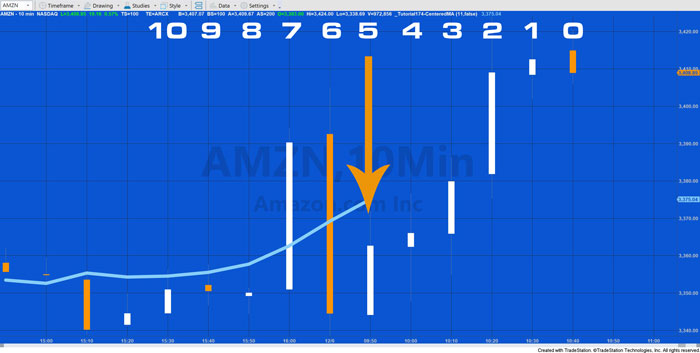
i.e. 5 bars on either side of the center bar.
Estimates are made for the CMA for last few bars on the chart. These bars are plotted in a different color, by default. In the example below the displaced plot is plotted in light magenta and the estimated bars are plotted in green. The earliest bar of the estimate remains on the chart after a new bar develops (hence the green plot is longer than 5 bars – the length in this example was 11.)
Tutorial 174 Overview Video
Download the tutorial 174 TradeStation EasyLanguage indicator for Gold Pass members
If you are a Gold Pass member you can download the tutorial ELD file below, please make sure that you are logged in with your Gold Pass user name and password.


THE TRADING APPS, INDICATORS, SHOW ME STUDIES, STRATEGIES AND OTHER PROGRAMS HAVE BEEN INCLUDED SOLELY FOR EDUCATIONAL PURPOSES.
TO THE BEST OF MARKPLEX CORPORATION’S KNOWLEDGE, ALL OF THE INFORMATION ON THIS PAGE IS CORRECT, AND IT IS PROVIDED IN THE HOPE THAT IT WILL BE USEFUL. HOWEVER, MARKPLEX CORPORATION ASSUMES NO LIABILITY FOR ANY DAMAGES, DIRECT OR OTHERWISE, RESULTING FROM THE USE OF THIS INFORMATION AND/OR PROGRAM(S) DESCRIBED, AND NO WARRANTY IS MADE REGARDING ITS ACCURACY OR COMPLETENESS. USE OF THIS INFORMATION AND/OR PROGRAMS DESCRIBED IS AT YOUR OWN RISK.
ANY EASYLANGUAGE OR POWERLANGUAGE TRADING STRATEGIES, TRADING APPS, SIGNALS, STUDIES, INDICATORS, SHOWME STUDIES, PAINTBAR STUDIES, PROBABILITYMAP STUDIES, ACTIVITYBAR STUDIES, FUNCTIONS (AND PARTS THEREOF) AND ASSOCIATED TECHNIQUES REFERRED TO, INCLUDED IN OR ATTACHED TO THIS TUTORIAL OR PROGRAM DESCRIPTION ARE EXAMPLES ONLY, AND HAVE BEEN INCLUDED SOLELY FOR EDUCATIONAL PURPOSES. MARKPLEX CORPORATION. DOES NOT RECOMMEND THAT YOU USE ANY SUCH TRADING STRATEGIES, SIGNALS, STUDIES, INDICATORS, SHOWME STUDIES, PAINTBAR STUDIES, PROBABILITYMAP STUDIES, ACTIVITYBAR STUDIES, FUNCTIONS (OR ANY PARTS THEREOF) OR TECHNIQUES. THE USE OF ANY SUCH TRADING STRATEGIES, SIGNALS, STUDIES, INDICATORS, SHOWME STUDIES, PAINTBAR STUDIES, PROBABILITYMAP STUDIES, ACTIVITYBAR STUDIES, FUNCTIONS AND TECHNIQUES DOES NOT GUARANTEE THAT YOU WILL MAKE PROFITS, INCREASE PROFITS, OR MINIMIZE LOSSES.