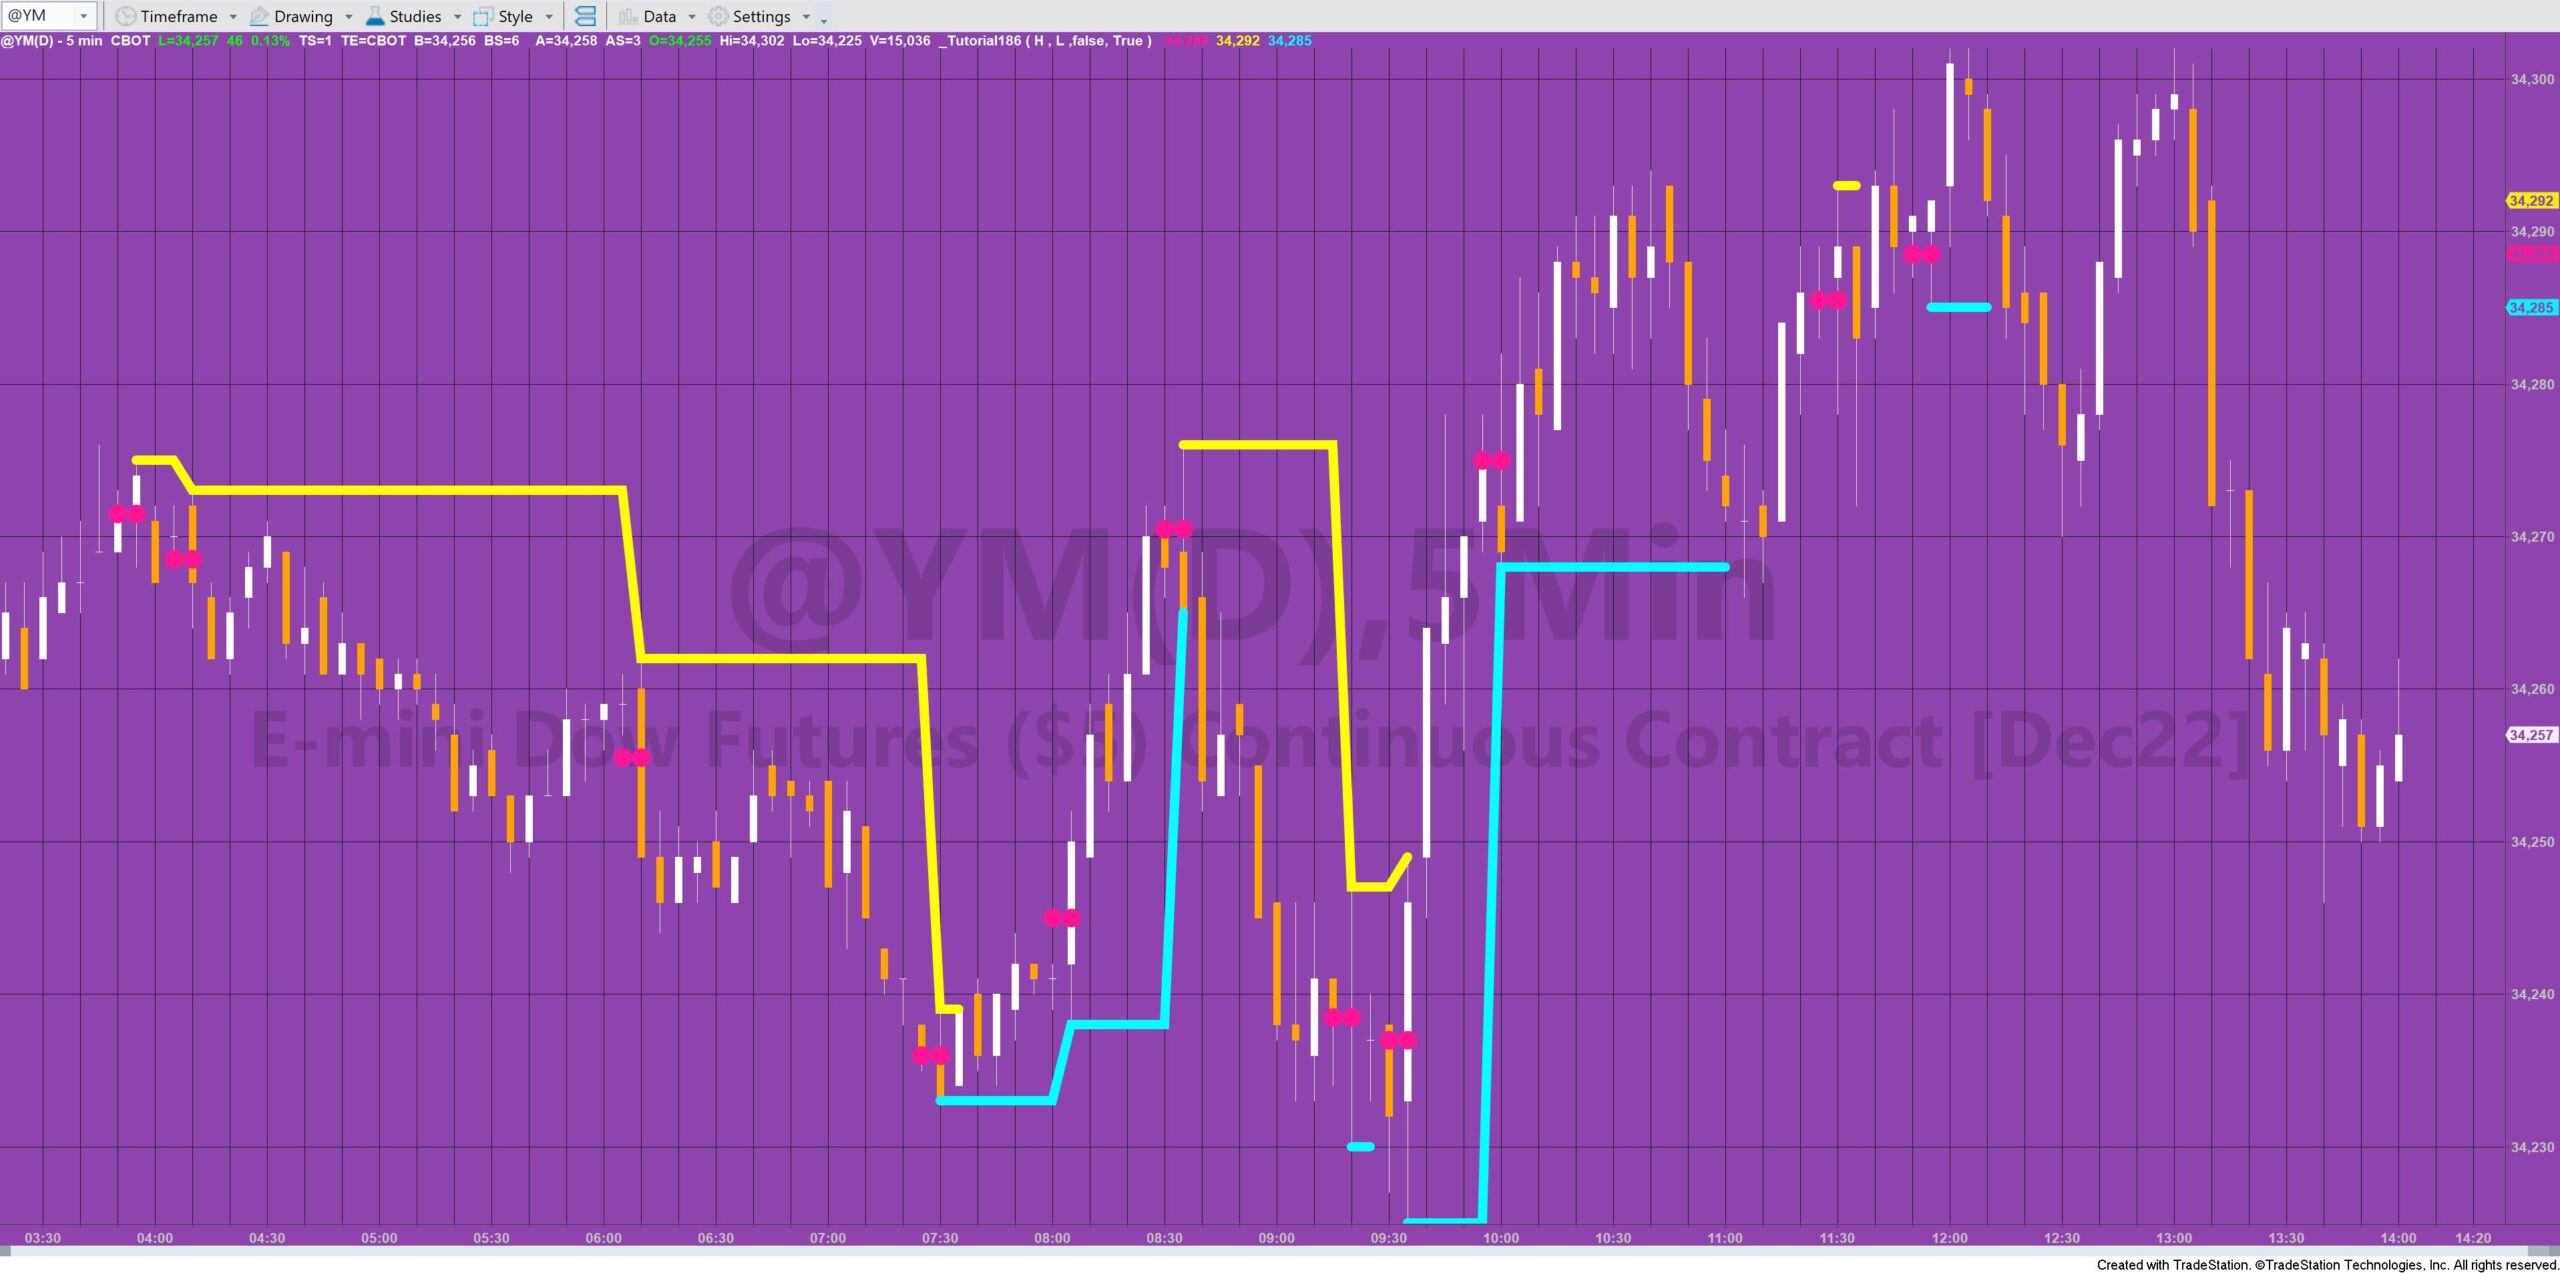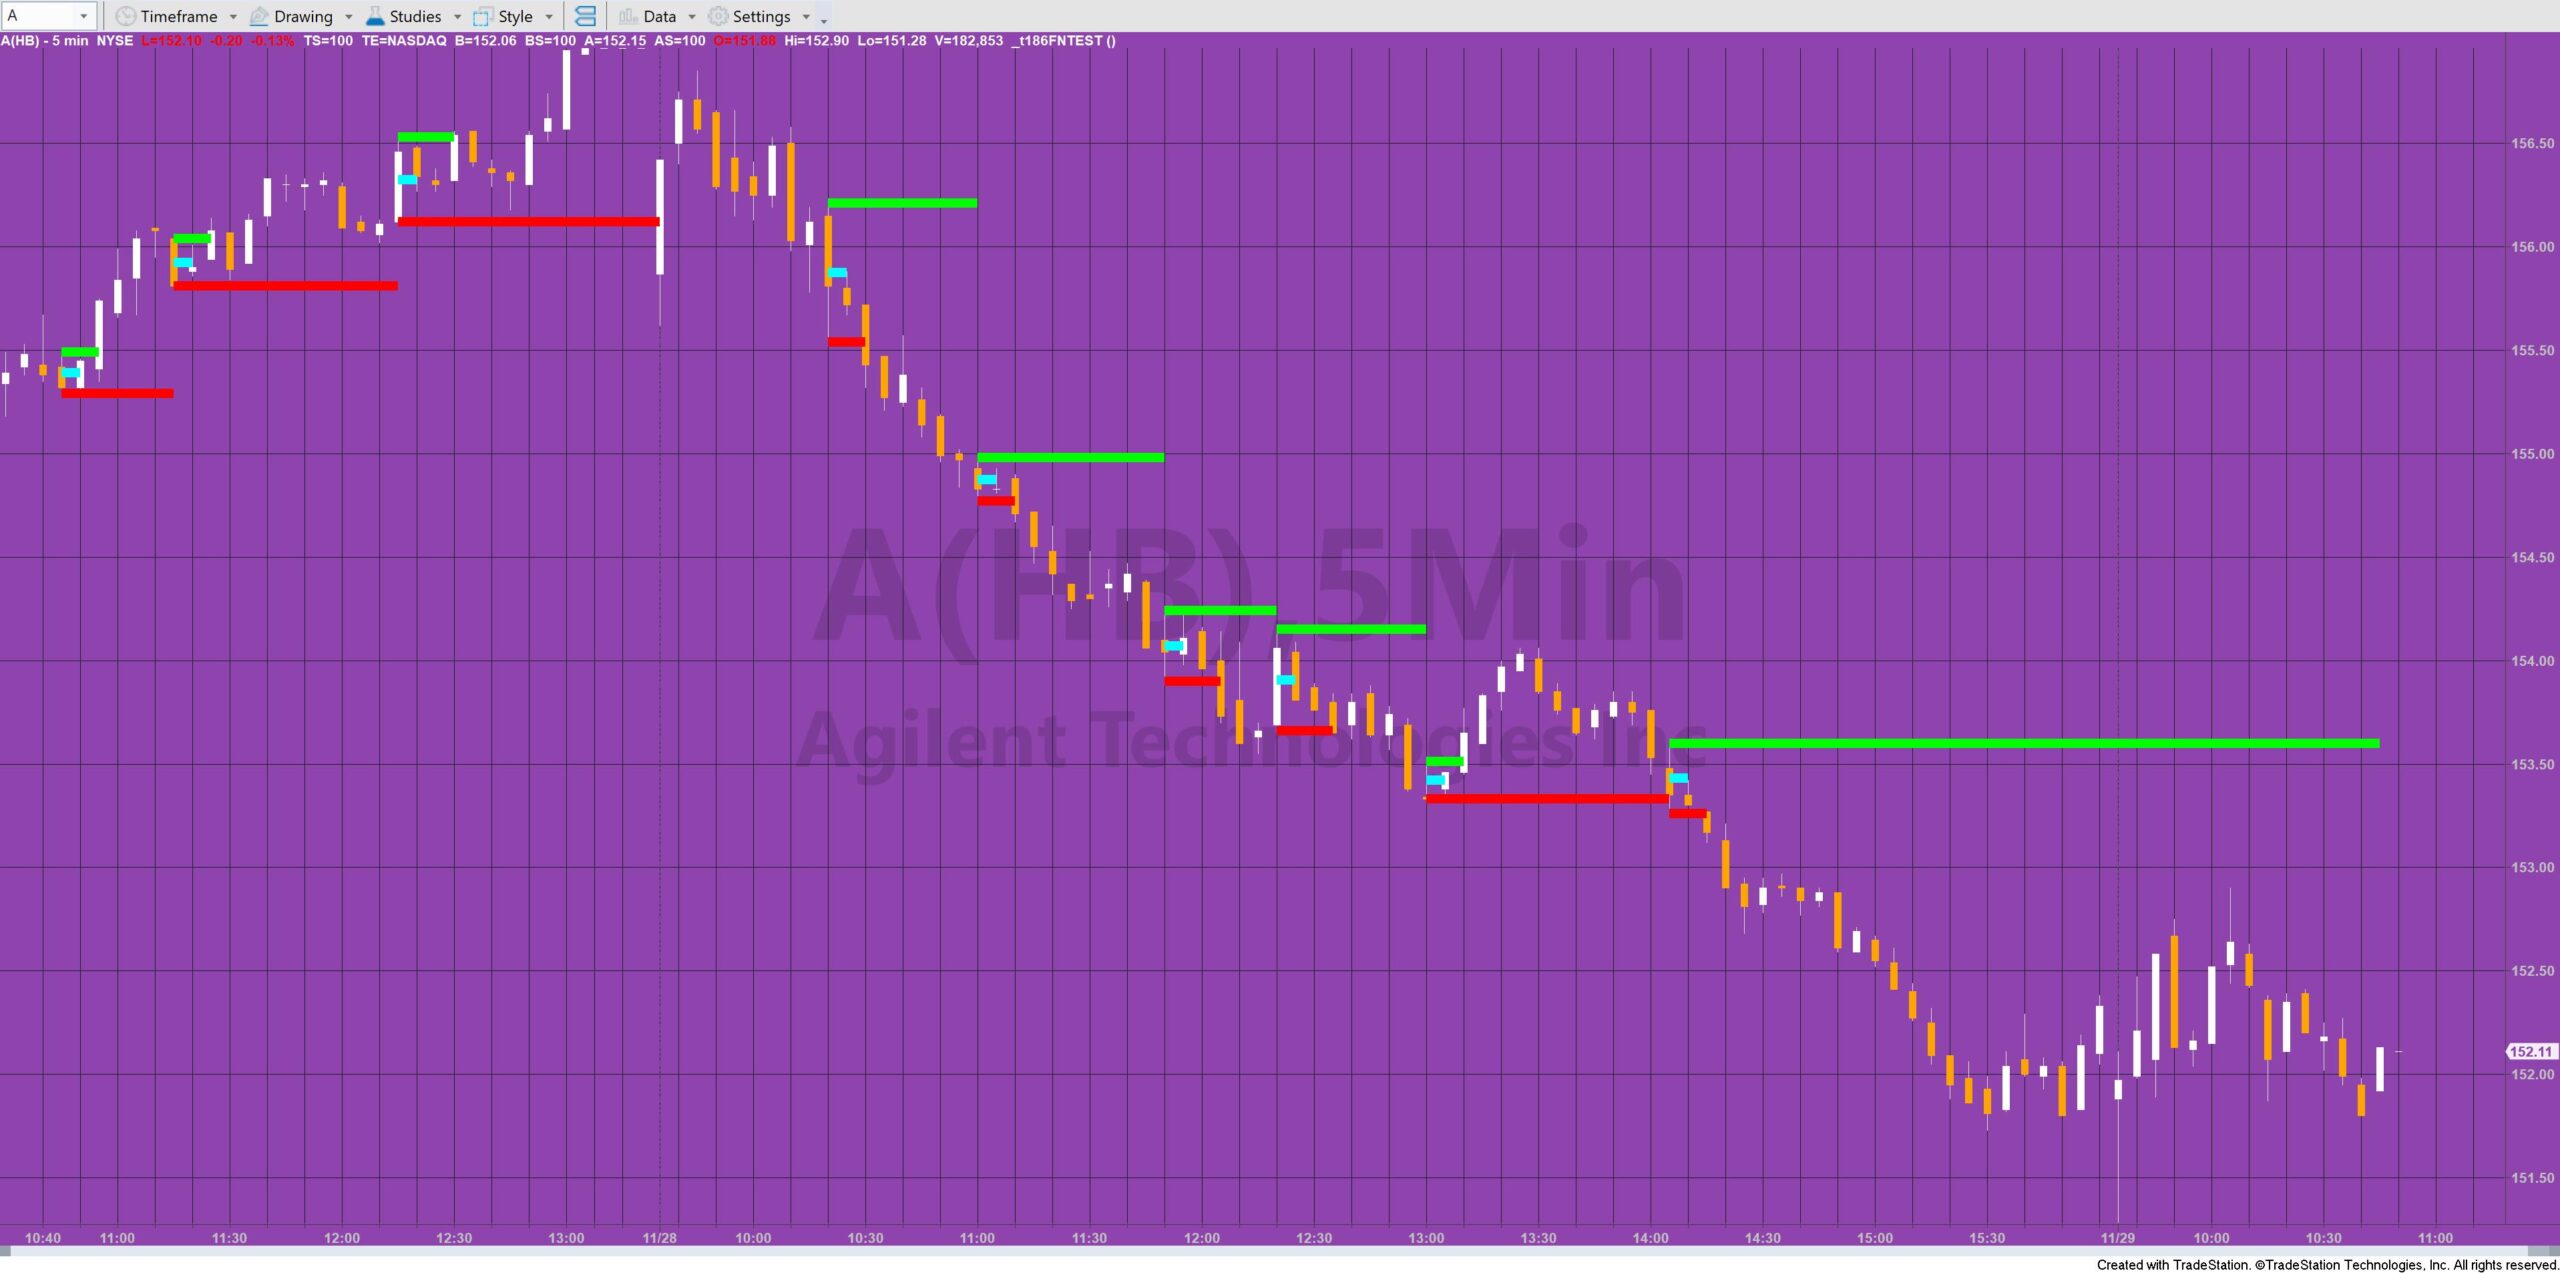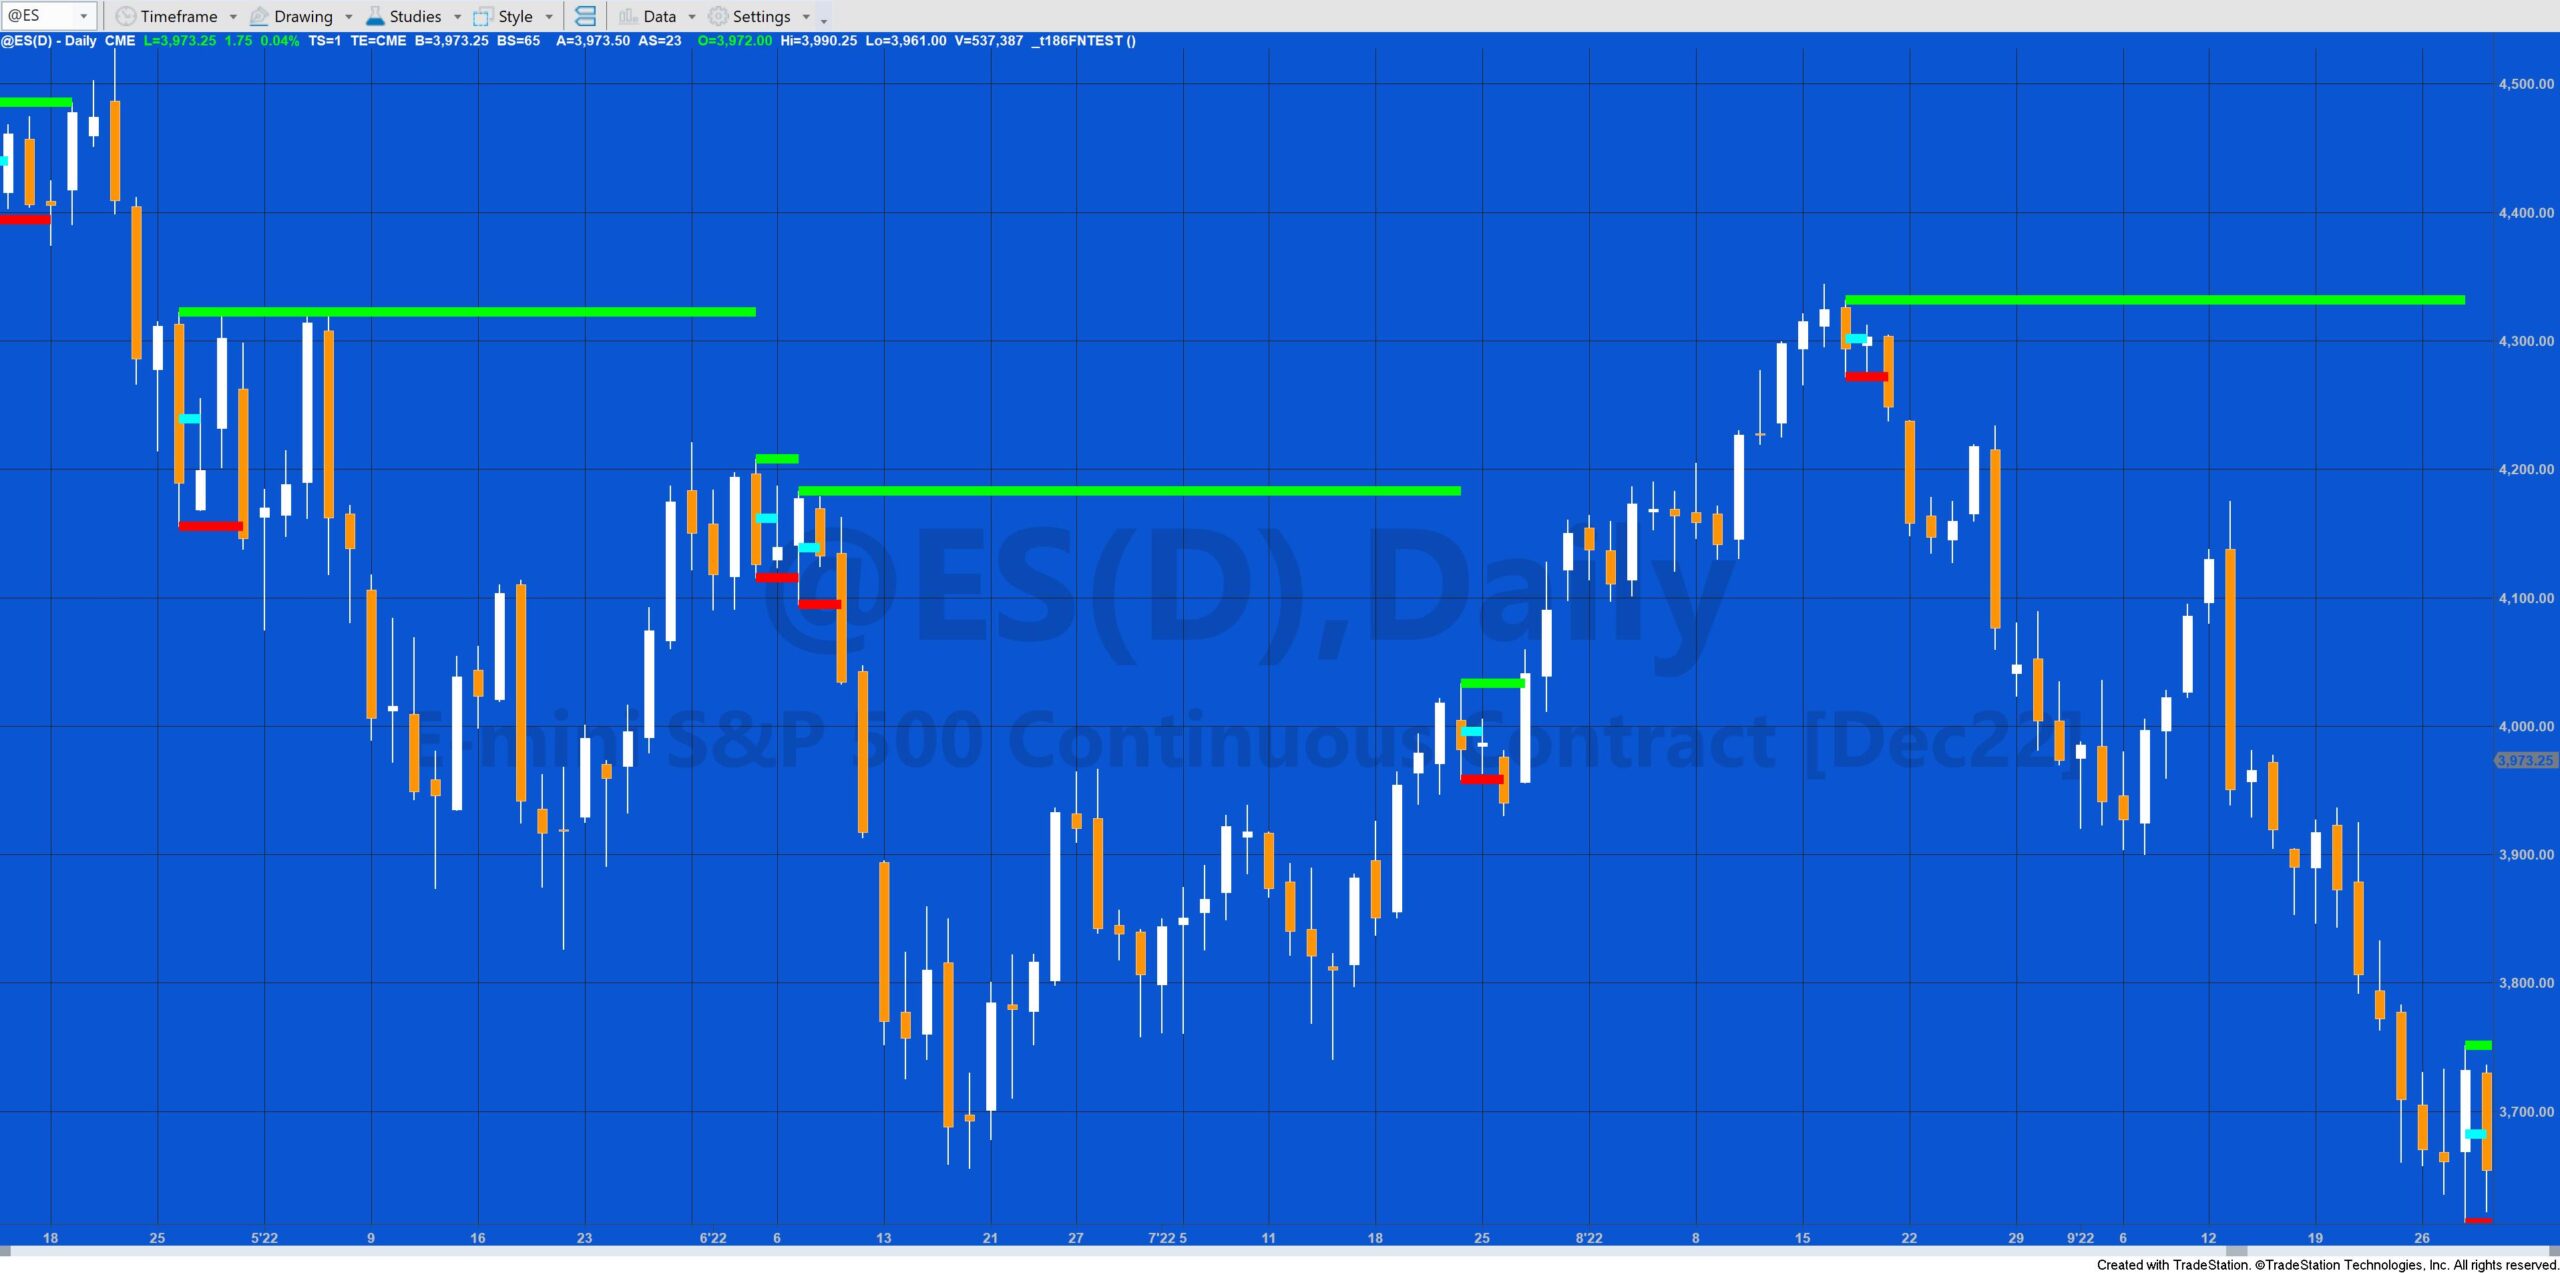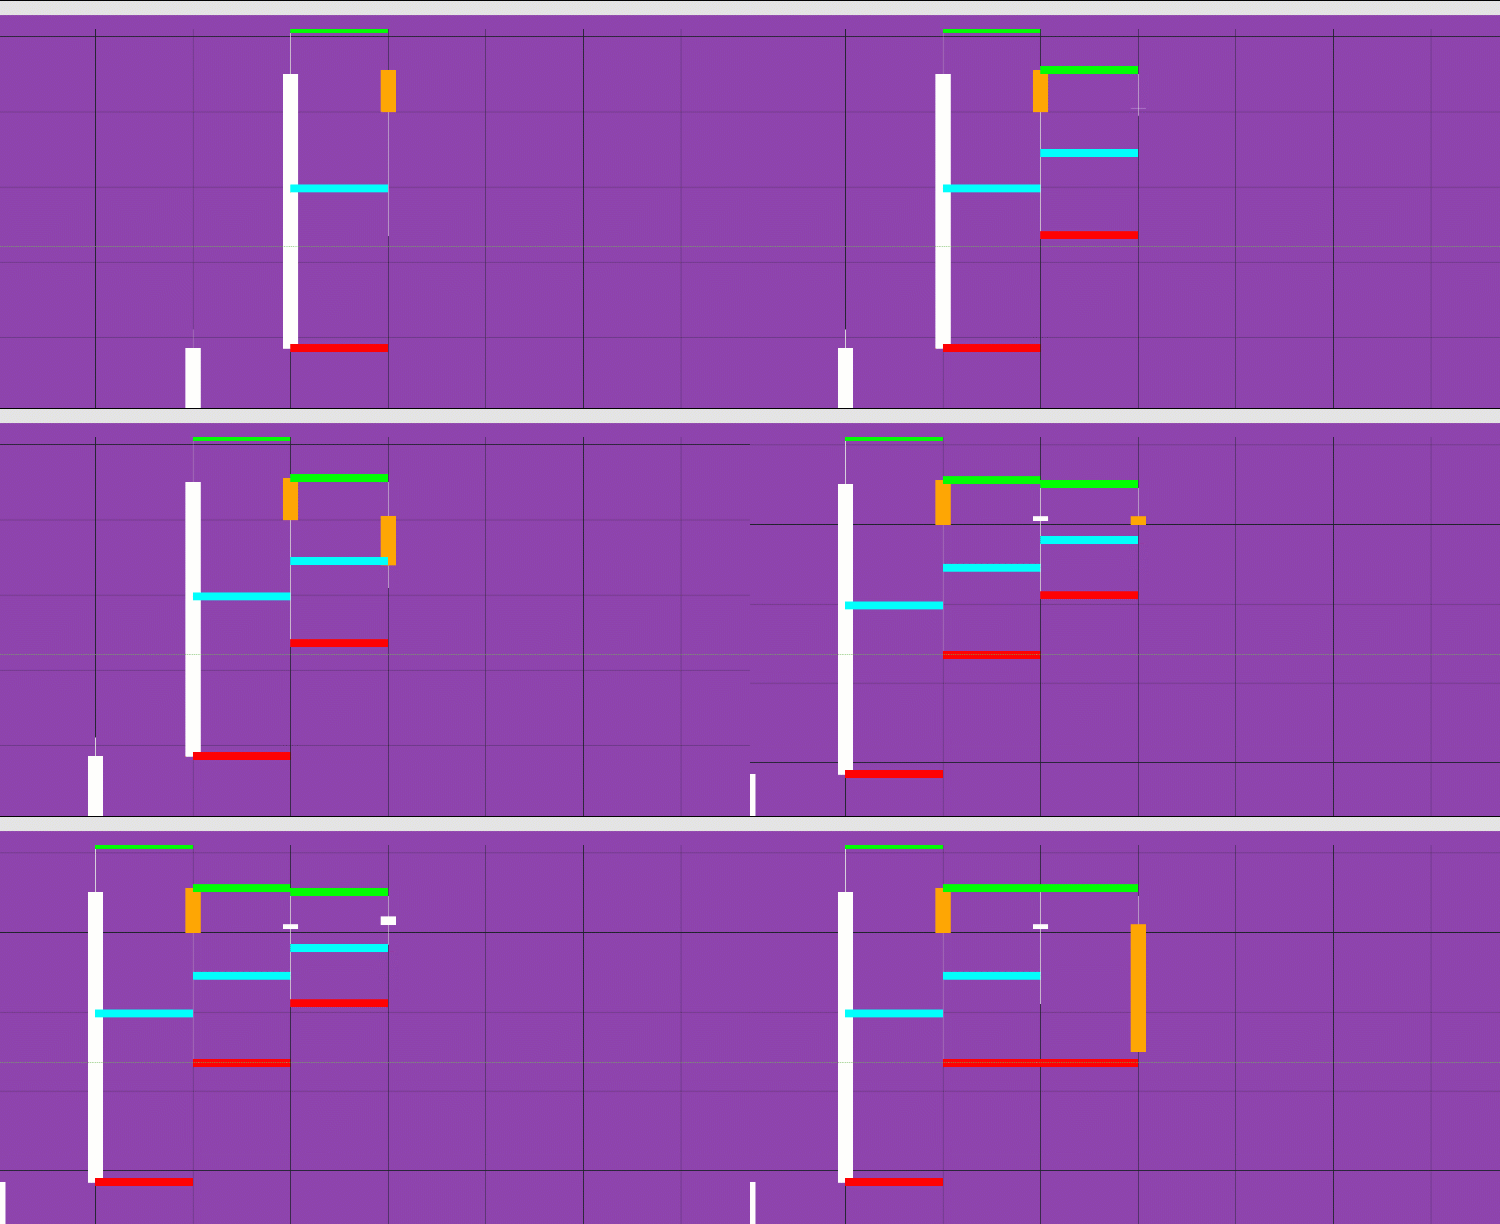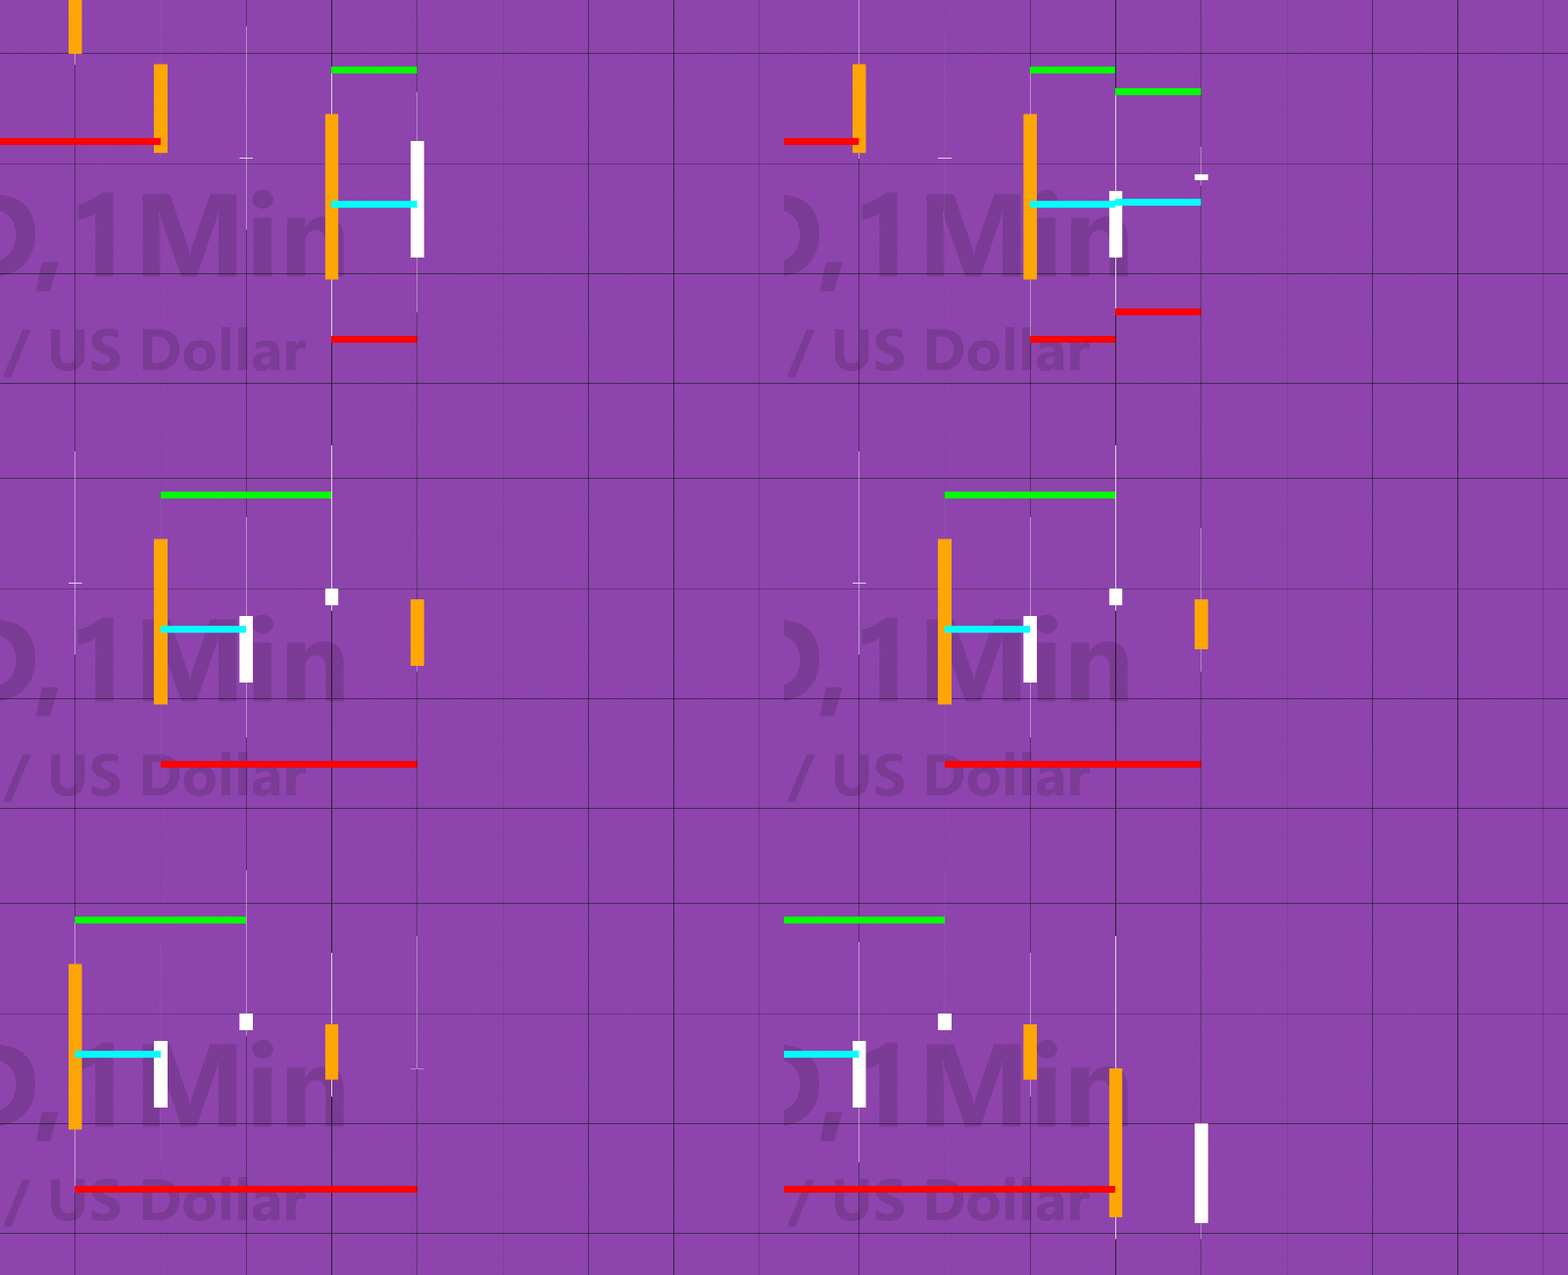
Tutorial 186 looks at three different approaches to analyzing a chart to find inside and outside bars and then drawing or plotting lines at their highs and lows until breached by price. The three approaches are:
- An indicator that plots the levels (_Tutorial186)
- A function (_Tutorial186fn) that does the same analysis as the indicator (_Tutorial186) and then draws the lines using the legacy drawing tools
- A function (_Tutorial186fnOJ) that does the same analysis as the indicator (_Tutorial186) and then draws the lines using drawing object
The programs have been tested with minute charts in TradeStation version 10. They could, potentially, be used with other price series inputs but have not been tested with anything other than high and low prices.
1. The tutorial 186 indicator version
Tutorial 186 indicator checks for inside bars and outside bars and then plots the high and the low of the pattern until either line is breached by price. The other line continues to be plotted (i.e if the price goes below the low line, it is stopped but the high line continues to be drawn.)
SETUP INFORMATION
To setup the program ensure the following:
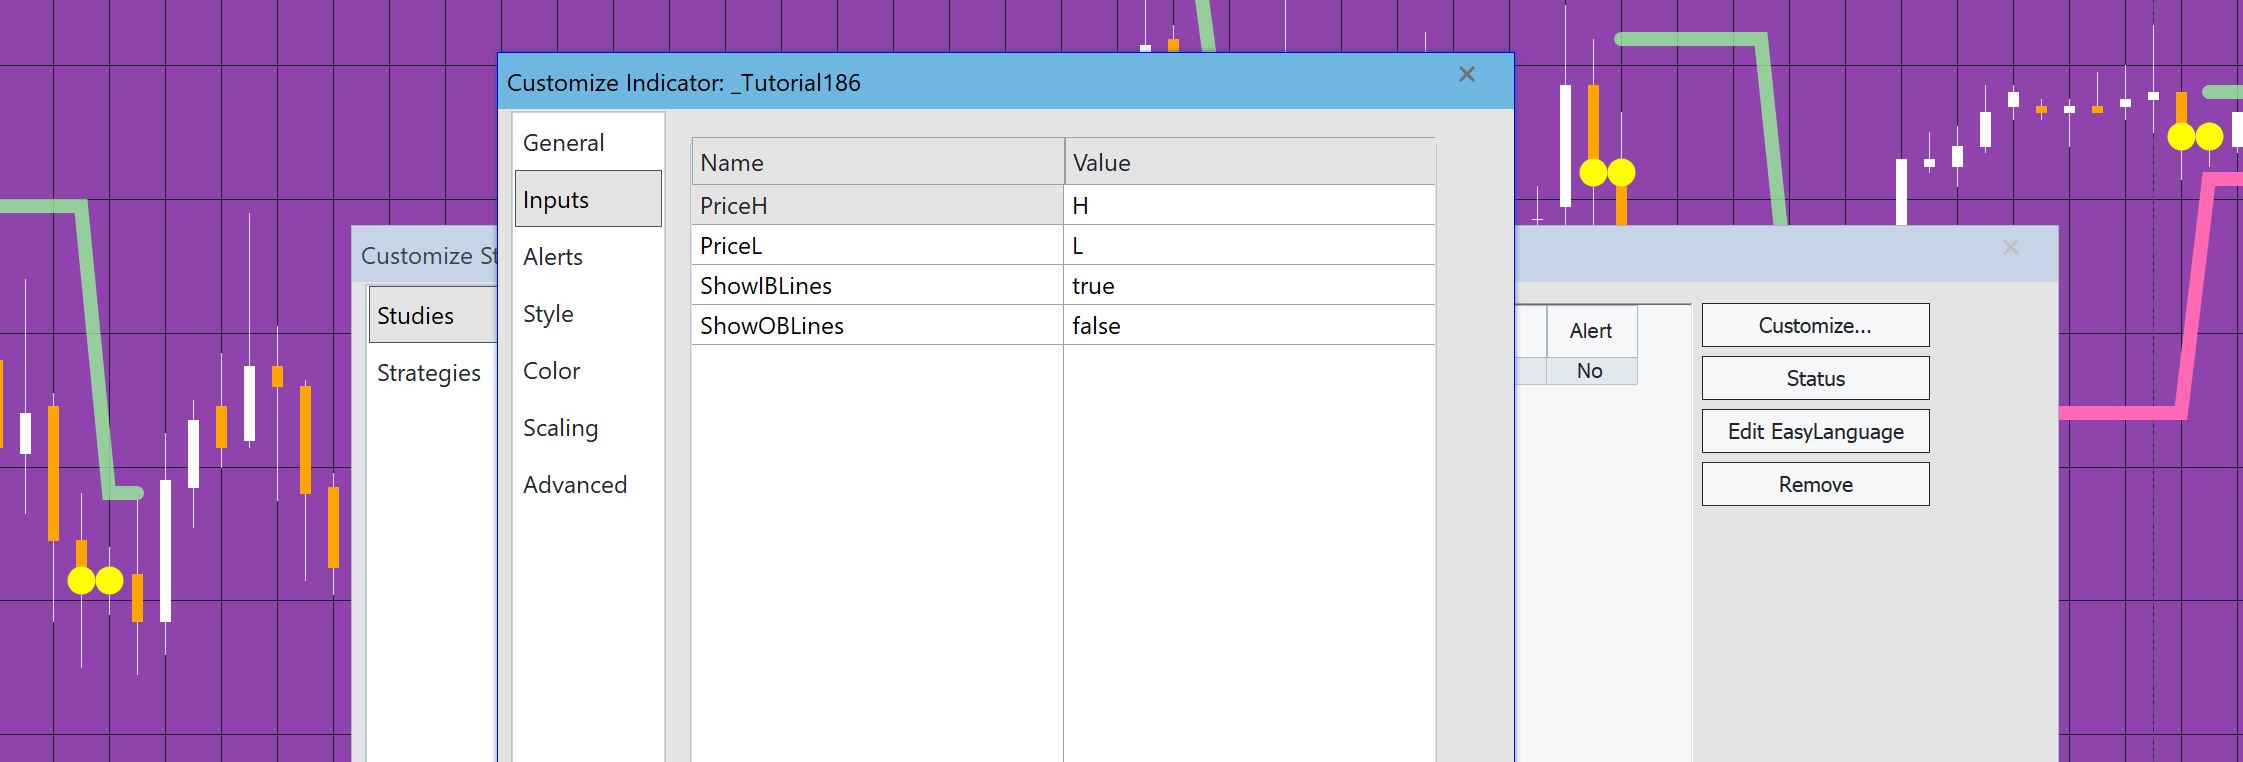
- The plot style is set to point for Plot1 and Plot5
- The plot style is set to line for Plot3, Plot4, Plot7 and Plot8
- Display update indication, display plot value in data line data tip and data window, and don’t automatically connect plot lines are all selected for Plot3, Plot4, Plot7, and Plot8
- Select preferred colors for all the plots
- Set scaling as same access as underlying data
Style settings
- Style settings for plots 3, 4, 7 and 8
- Style settings for plots 1 and 5
2. Function that draws lines using the legacy drawing tools
In the second program the analysis is done in a function. Rather than plotting the lines (plots are not allowed in functions) the lines are drawn using the legacy drawing tools. The following is a short excerpt from the function:
// Draw a line showing the inside/outside  bar high if it has not been crossed (i.e. StopIS_OSH is false)
Value2 = TL_New( D[1], T[1], IS_OSCurrHi, D, T, IS_OSCurrHi );
TL_SetColor( Value2, Green ); // Set color
TL_SetSize( Value2, 6 ); // Set thickness
The function can be called from another program using the following syntax:
VALUE1 = _Tutorial186fn( H, L, true ); // Call the function that draws lines using legacy drawing tools
The last input determines whether the function highlights inside or outside bars. If it is set to TRUE it looks for inside bars. If it is set to FALSE it looks for outside bars.
Video explaining tutorial 186 function that uses legacy drawing tools
3. Function that draws lines using the trendline drawing object
In this third program the analysis is done in a function. Rather than plotting the lines (plots are not allowed in functions) the lines are drawn using the drawing object. . The following is a short excerpt from the function:
/TLObj = TrendLine.create( DTPoint.Create( DateTime.FromELDateAndTime( _date1, _Time1 ), Price1 ),
DTPoint.Create( DateTime.FromELDateAndTime( _Date2, _Time2 ), Price2 ) );// Create an instance of a trendline object based on two points
TLObj.Persist = True; // Trendline remains on screen after tick refreshes
TLObj.Style = 1; // Trendline will be drawn as a solid line
TLObj.Weight = 6;
TlObj.Color = Color.FromName( Colour );
TLObj.ExtRight = FALSE;
DrawingObjects.Add( TLObj );
This functionality is included in a method that is called each time a new line needs to be drawn.
The function can be called from another program using the following syntax:
Value1 = _Tutorial186fnOJ( H, L, True ); // Call the function that draws lines using drawing objects
The last input determines whether the function highlights inside or outside bars. If it is set to TRUE it looks for inside bars. If it is set to FALSE it looks for outside bars.
The following unprotected programs are included:
- _Tutorial186 (an indicator)
- _t186FNTEST (an indicator)
- _Tutorial186fn (a function)
- _Tutorial186fnOJ (a function)
The tutorial indicator program is compatible with MultiCharts as is the function that uses legacy drawing tools. The other function is not compatible.
TO THE BEST OF MARKPLEX CORPORATION’S KNOWLEDGE, ALL OF THE INFORMATION ON THIS PAGE IS CORRECT, AND IT IS PROVIDED IN THE HOPE THAT IT WILL BE USEFUL. HOWEVER, MARKPLEX CORPORATION ASSUMES NO LIABILITY FOR ANY DAMAGES, DIRECT OR OTHERWISE, RESULTING FROM THE USE OF THIS INFORMATION AND/OR PROGRAM(S) DESCRIBED, AND NO WARRANTY IS MADE REGARDING ITS ACCURACY OR COMPLETENESS. USE OF THIS INFORMATION AND/OR PROGRAMS DESCRIBED IS AT YOUR OWN RISK.
ANY EASYLANGUAGE OR POWERLANGUAGE TRADING STRATEGIES, SIGNALS, STUDIES, INDICATORS, SHOWME STUDIES, PAINTBAR STUDIES, PROBABILITYMAP STUDIES, ACTIVITYBAR STUDIES, FUNCTIONS (AND PARTS THEREOF) AND ASSOCIATED TECHNIQUES REFERRED TO, INCLUDED IN OR ATTACHED TO THIS TUTORIAL OR PROGRAM DESCRIPTION ARE EXAMPLES ONLY, AND HAVE BEEN INCLUDED SOLELY FOR EDUCATIONAL PURPOSES. MARKPLEX CORPORATION. DOES NOT RECOMMEND THAT YOU USE ANY SUCH TRADING STRATEGIES, SIGNALS, STUDIES, INDICATORS, SHOWME STUDIES, PAINTBAR STUDIES, PROBABILITYMAP STUDIES, ACTIVITYBAR STUDIES, FUNCTIONS (OR ANY PARTS THEREOF) OR TECHNIQUES. THE USE OF ANY SUCH TRADING STRATEGIES, SIGNALS, STUDIES, INDICATORS, SHOWME STUDIES, PAINTBAR STUDIES, PROBABILITYMAP STUDIES, ACTIVITYBAR STUDIES, FUNCTIONS AND TECHNIQUES DOES NOT GUARANTEE THAT YOU WILL MAKE PROFITS, INCREASE PROFITS, OR MINIMIZE LOSSES.

