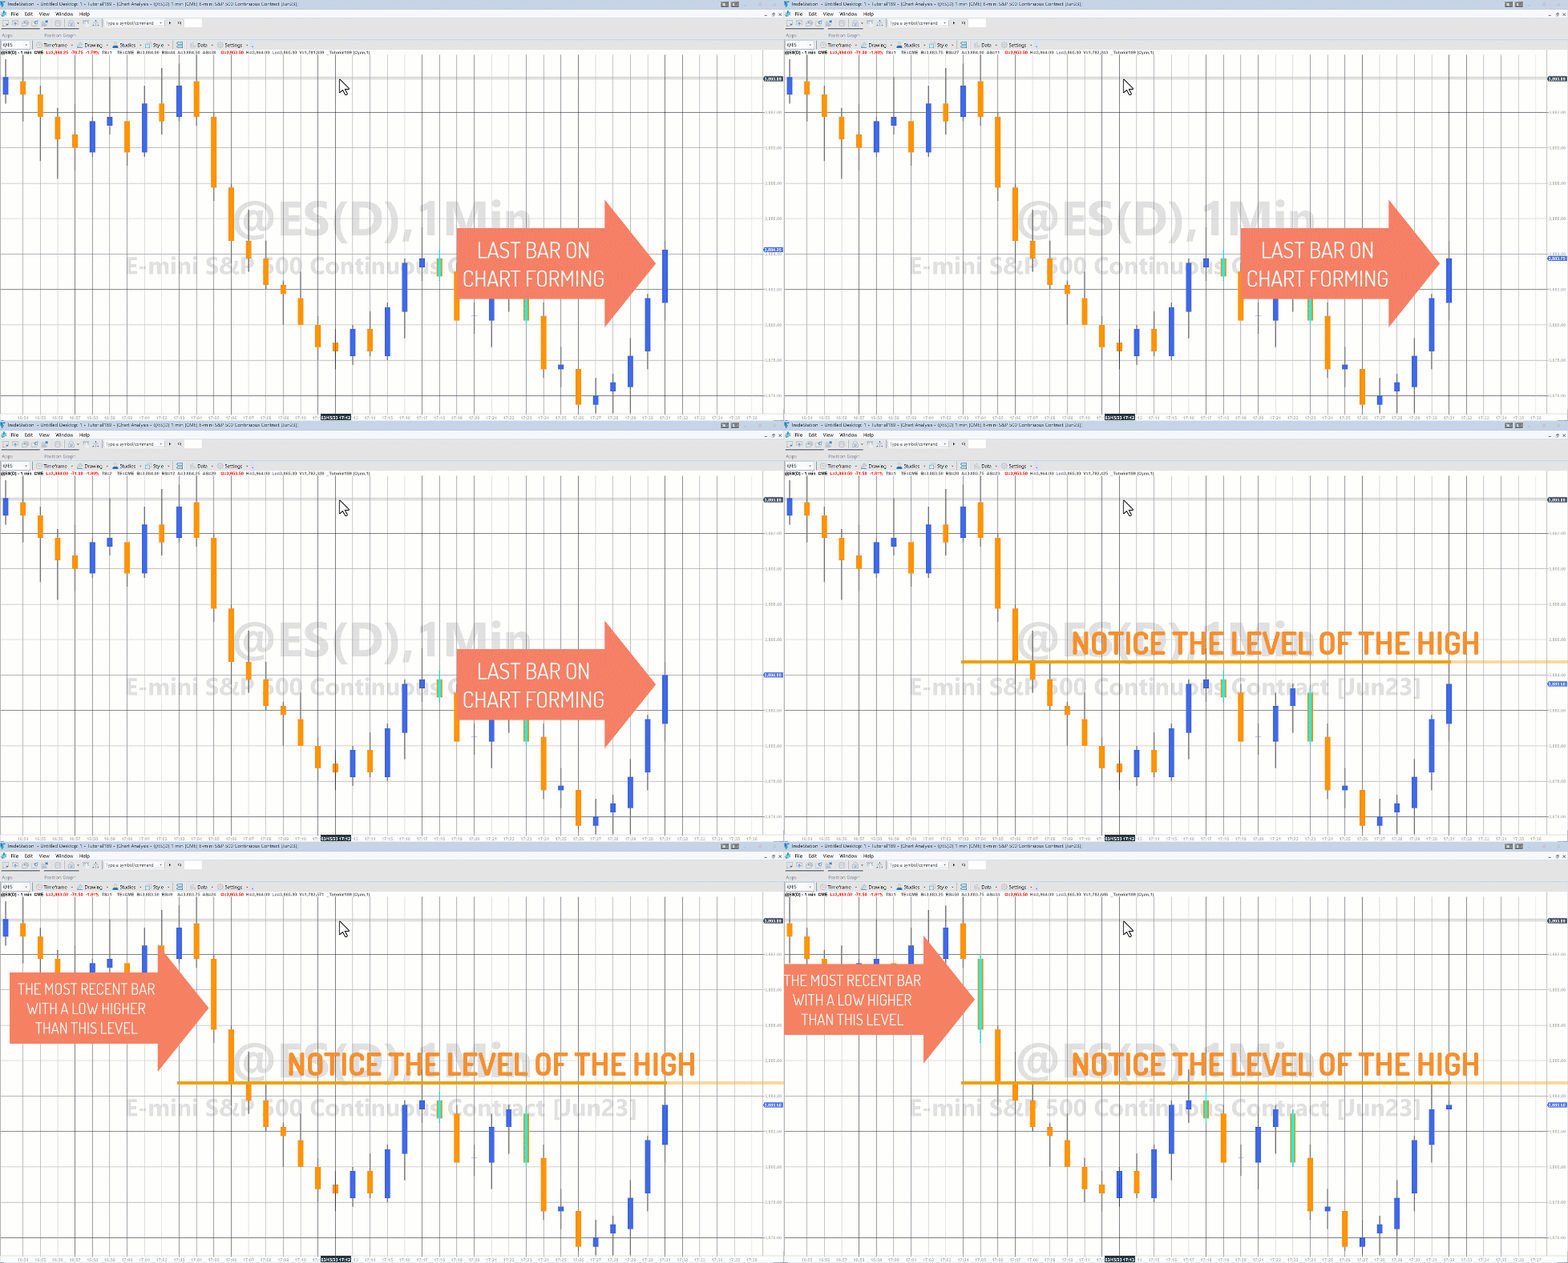
The shapes and explanatory text in the above image were added manually
Tutorial 189 takes the high of the last completed bar and searches back in time for the most recent bar where the low of that bar is greater than the high of the last completed bar.

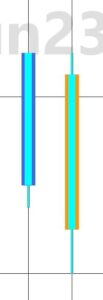
The bar that meets this criteria is then plotted over using PlotPB or alternatively is highlighted by drawing trendlines between its high and low and open and close (see example image on the right). The trendlines are set to cyan.
The program then searches again for the next completed bar.
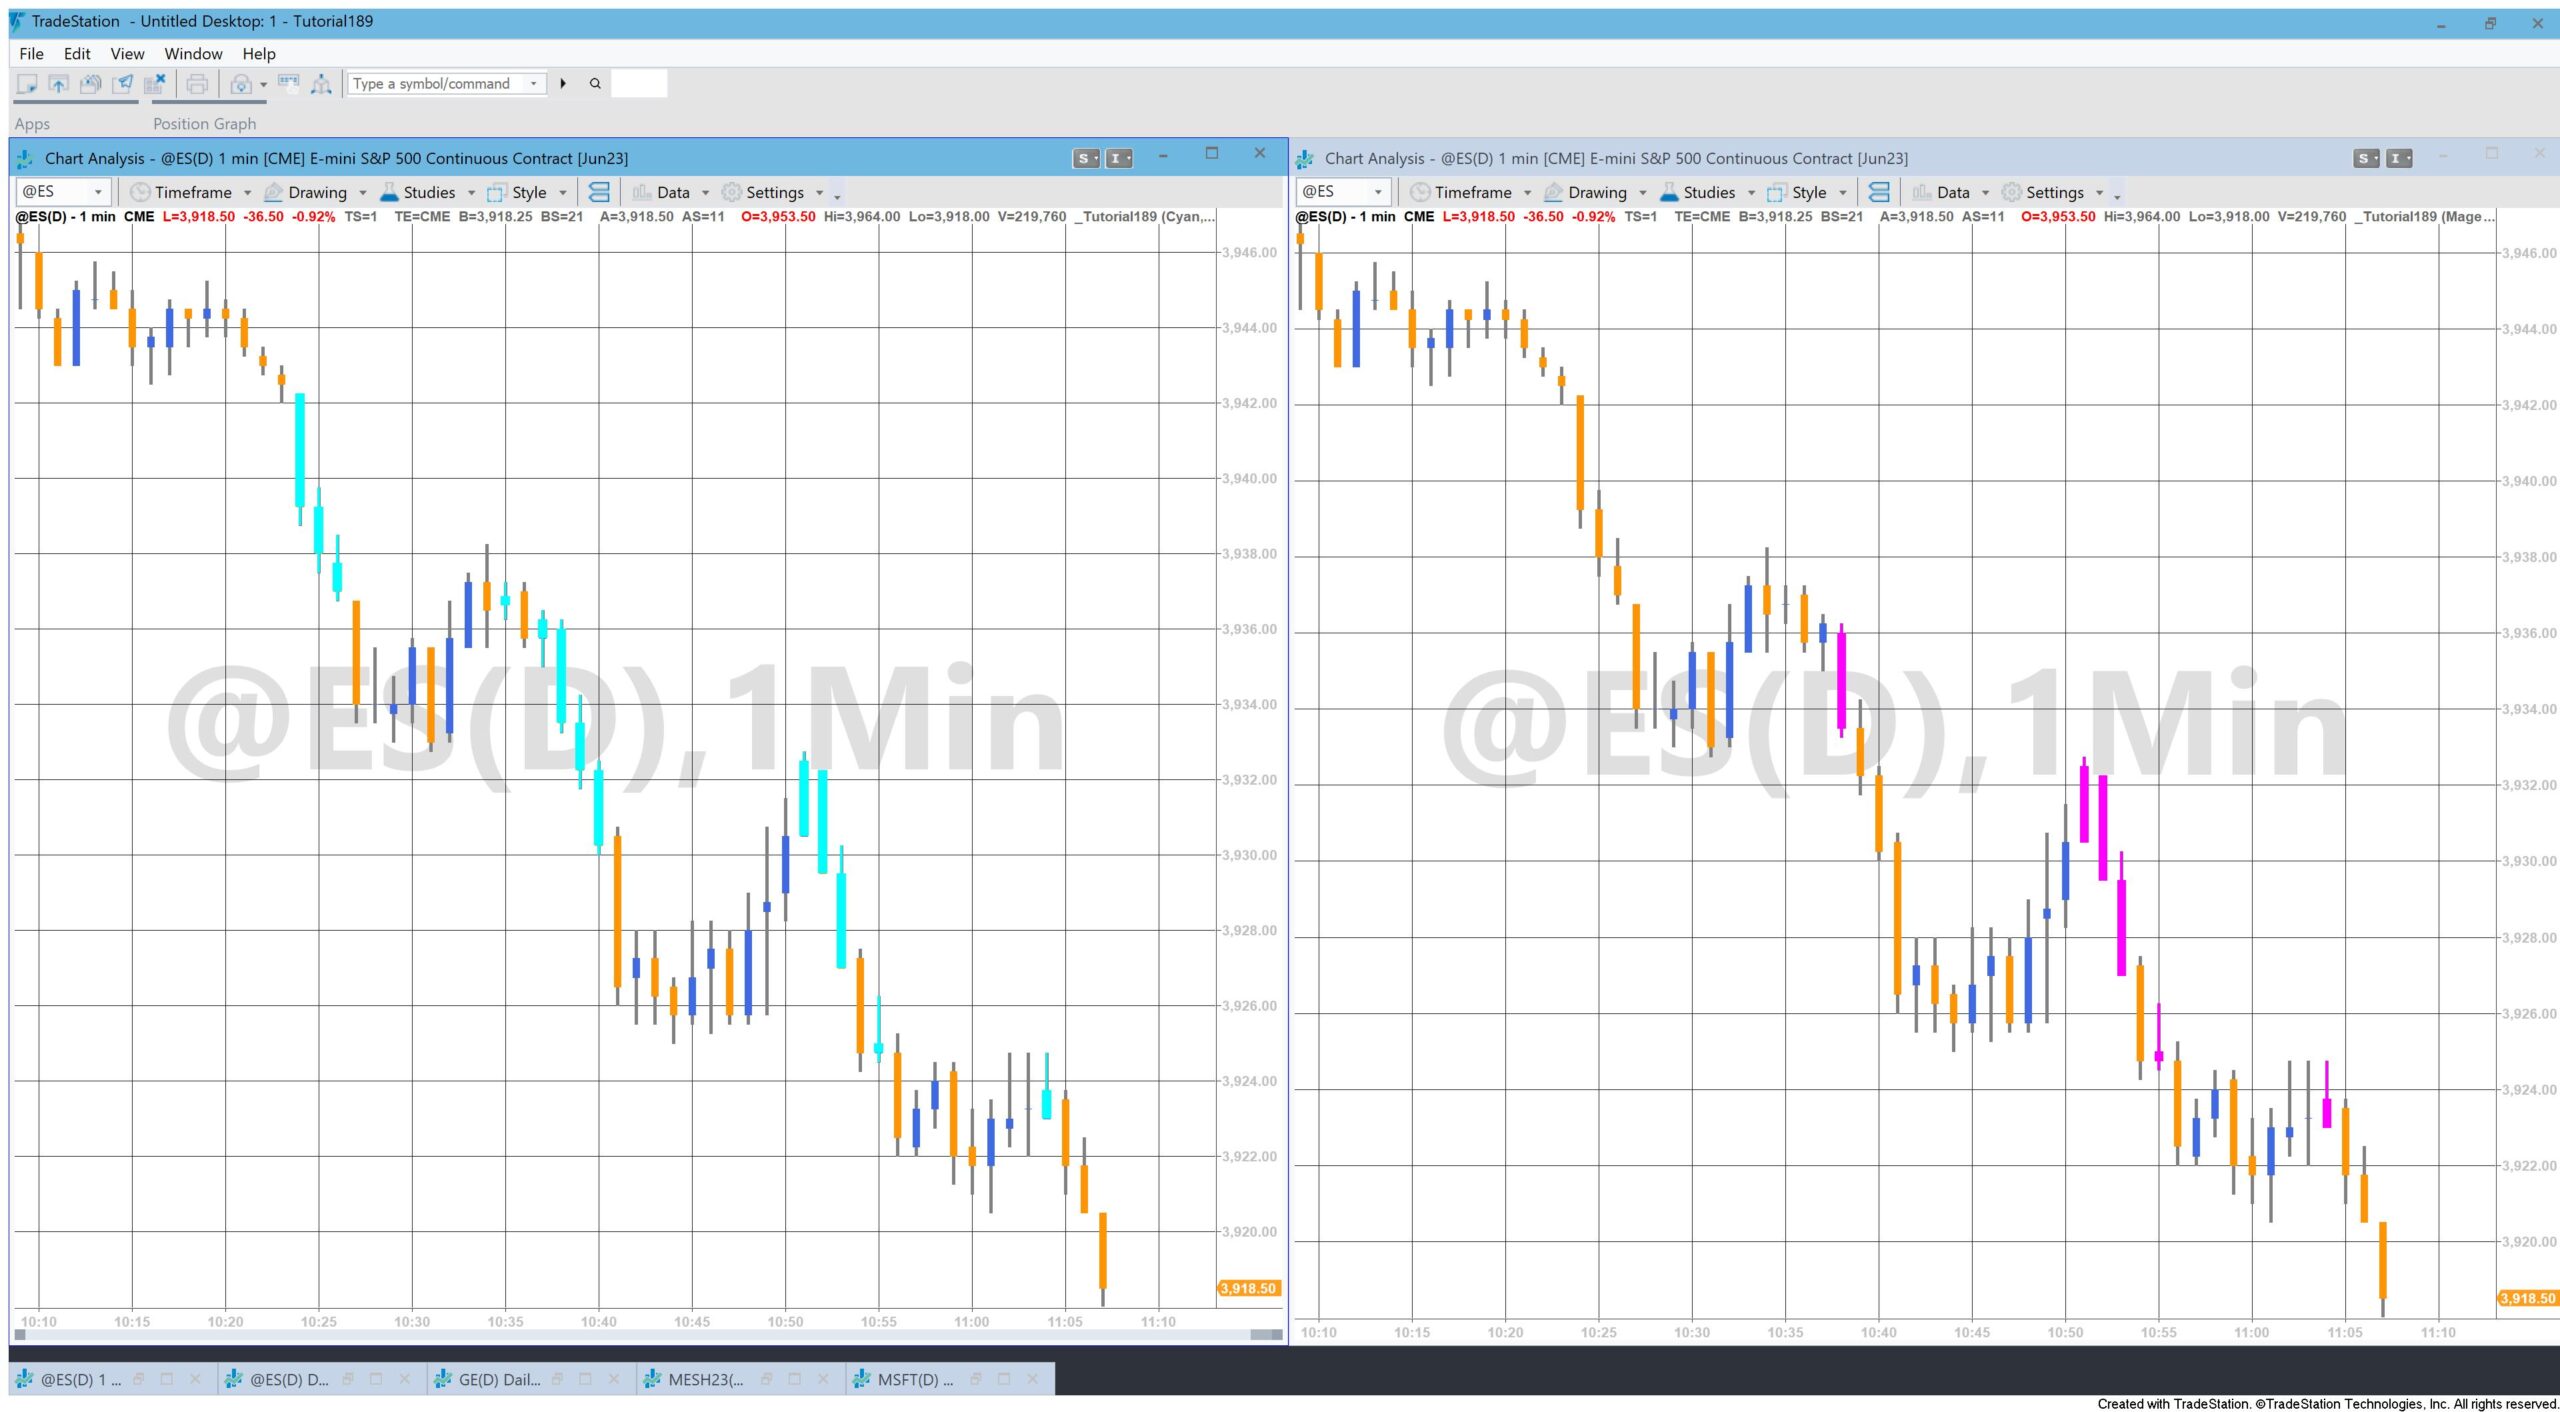
The problem with the PlotPB approach is that it changes the MaxBarsBack setting (see a note about maximum number of bars a study will reference or MaxBarsBack below). As older bars are found the MaxBarsBack setting is increased. This can be problematic for two reasons:
- When the MaxBarsBack is recalculated the whole program is run again and bars previously highlighted will now no longer be highlighted.
- MaxBarsBack bars at the start of the chart are not available for analysis.
The first issue could be solved by keeping a record of when the highlighted bars occurred and then replotting them if necessary, however the second issue remains. Overall the drawing tool approach is a simpler one.
Using the legacy trend line tool does not alter the MaxBarsBack setting. It does require the user to approximate the size of the wick and the body of the bar found using TL_SetSize.

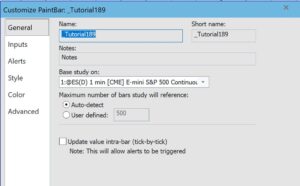
‘Maximum number of bars study will reference’ should be set to auto-detect and ‘Update value intra-bar’ should not be clicked
Inputs
Col( Red ), // Color of plot or drawn line
PBorDraw( 0 ); // 0 = PlotPB, 1 = draw
The chart on the left is using the legacy drawing tool. The chart on the right is using PlotPB. Notice that the displayed bars are different due to the problems caused when the program recalculates when the MaxBarsBack setting is increased.
Explanation of tutorial 189
If you are a Gold Pass member you can download the tutorial 189 programs for free. (Make sure that you are logged into Gold Pass): ![]() This content is for members only.
This content is for members only.
TO THE BEST OF MARKPLEX CORPORATION’S KNOWLEDGE, ALL OF THE INFORMATION ON THIS PAGE IS CORRECT, AND IT IS PROVIDED IN THE HOPE THAT IT WILL BE USEFUL. HOWEVER, MARKPLEX CORPORATION ASSUMES NO LIABILITY FOR ANY DAMAGES, DIRECT OR OTHERWISE, RESULTING FROM THE USE OF THIS INFORMATION AND/OR PROGRAM(S) DESCRIBED, AND NO WARRANTY IS MADE REGARDING ITS ACCURACY OR COMPLETENESS. USE OF THIS INFORMATION AND/OR PROGRAMS DESCRIBED IS AT YOUR OWN RISK.
ANY EASYLANGUAGE OR POWERLANGUAGE TRADING STRATEGIES, SIGNALS, STUDIES, INDICATORS, SHOWME STUDIES, PAINTBAR STUDIES, PROBABILITYMAP STUDIES, ACTIVITYBAR STUDIES, FUNCTIONS (AND PARTS THEREOF) AND ASSOCIATED TECHNIQUES REFERRED TO, INCLUDED IN OR ATTACHED TO THIS TUTORIAL OR PROGRAM DESCRIPTION ARE EXAMPLES ONLY, AND HAVE BEEN INCLUDED SOLELY FOR EDUCATIONAL PURPOSES. MARKPLEX CORPORATION. DOES NOT RECOMMEND THAT YOU USE ANY SUCH TRADING STRATEGIES, SIGNALS, STUDIES, INDICATORS, SHOWME STUDIES, PAINTBAR STUDIES, PROBABILITYMAP STUDIES, ACTIVITYBAR STUDIES, FUNCTIONS (OR ANY PARTS THEREOF) OR TECHNIQUES. THE USE OF ANY SUCH TRADING STRATEGIES, SIGNALS, STUDIES, INDICATORS, SHOWME STUDIES, PAINTBAR STUDIES, PROBABILITYMAP STUDIES, ACTIVITYBAR STUDIES, FUNCTIONS AND TECHNIQUES DOES NOT GUARANTEE THAT YOU WILL MAKE PROFITS, INCREASE PROFITS, OR MINIMIZE LOSSES.


