
Welcome to tutorial 19 in this series of tutorials that demonstrate and explain TradeStation EasyLanguage programming concepts. The idea behind the series is that if you learn the TradeStation EasyLanguage yourself, you will have a skill that will enable you to program and try out trading ideas without the need to use a professional programmer.
As always, the purpose of this tutorial is to demonstrate the programming techniques rather than to create a tradable indicator. This tutorial was created using TradeStation version 8.3 and works in later versions including TradeStation 9.5 and 10 and MultiCharts.
I recently read an article in Stocks, Futures and Options magazine about a technical trading methodology that utilized volume to try and understand when tops or bottoms of the market may occur.
Often traders will create a plot on a chart by applying a Volume Indicator and an average volume indicator.
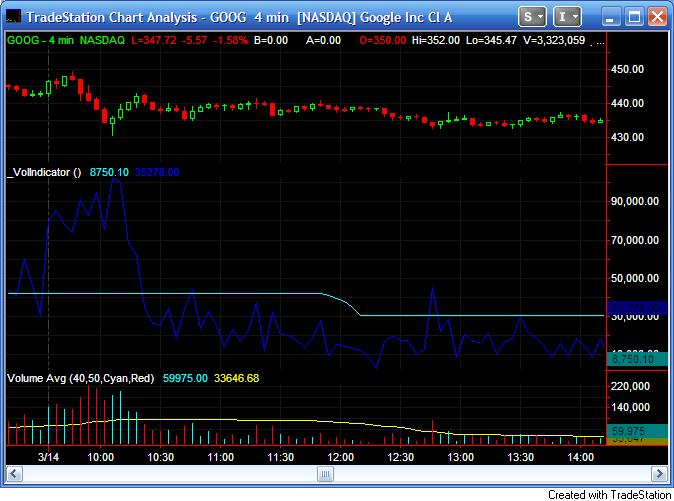
In the following chart I added the Vol Avg indicator (click Insert – Indicator and scroll down until you find Vol – Avg). The chart will look something like this:
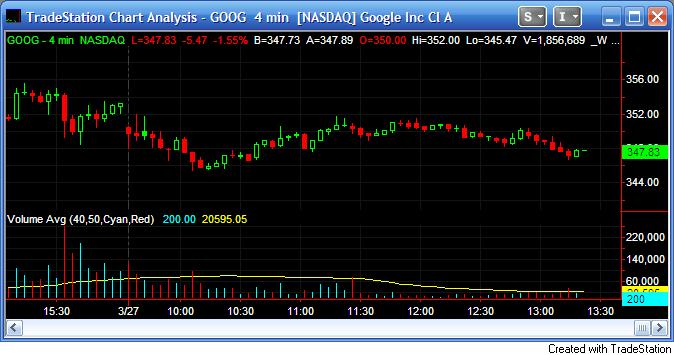
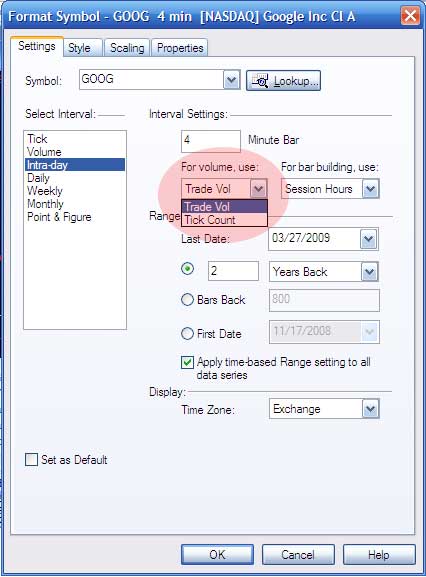
The chart shows volume (the red and cyan vertical bars below the chart) and an average of the volume (the yellow line). Incidentally, the symbol settings allow two options for volume (see below). They are Trade Vol and Tick Count. The meanings of these terms vary depending on the timescale of the chart you are using. For an ‘intraday chart, ‘ i.e. a 1, 5 or 60 minute etc chart, if the ‘For volume use’ is set to ‘Trad Vol’ then the volume shown is ‘up volume’ (or volume that occurs on an uptick). If it is set to ‘Tick Count’ then volume is shown as ‘up ticks.’
. You will need to log in to your account to access the information.
This gave me the idea that while the technique I read about may be useful, it is calculating volume based on parts of the day that you may not be interested in. For example, say you wanted to create a strategy or indicator that focused on the volumes that occurred between 11:00 and 12:00 and JUST between those times of day. So, for example, say you were using a 10 minute chart and you wanted to find the 30 bar average JUST between 11:00 and 12:00. Imagine it is now 1:00 p.m. then the program would need to average the volume for the bars between 11:00 and 12:00 today (6 bars on a 10 minute chart), 11:00 and 12:00 the previous day (6 bars), 11:00 and 12:00 the day before that (6 bars) and so on until we were calculating the average volume of 30 bars.
CAUTION: For the technique described below you need to make sure that the MaxBarsBack setting is high enough. More about this below.
Step 1 – Create a new function
We will name the function we are creating _AVtweenTimes and we will pass four inputs to the function:
- StartTime
- EndTime
- Value to be passed (I have spoken about using this function to calculate volume averages, but it could also be used to find the average of price series
- Length
A call to the function will look like:
_AVtweenTimes( 1154, 1210, V, 20 )
Where 1154 is the start time, 1210 is the end time, V (or volume) is what th eprogram will calculate the average of and 20 is the length of the average.
Tradestation provides a lot of useful functions and other Easylanguage programs and it is often instructive to open the programs and see how Tradestation programmed them. A good example is the Average function. If you open it you will see that it calls another function which sums the value of a specific attribute of a number of previous bars depending on the value of the length input. Opening the Summation function reveals how this is achieved.
The function uses a ‘for’ construct to count backwards the last ‘length’ bars (including the current bar) and calculates their sum.
For Value1 = 0 to Length - 1
Begin
Sum = Sum + Price[Value1] ;
End ;
Our function will behave similarly, but with several significant differences. So let’s get started…..
Create a new function named _AVtweenTimes (click File – New- Window, select the EasyLanguage tab and click Function.) Make sure the return type is Double Numeric).
Enter the following code (if you are a Gold Pass member, the example indicator and function are available as a free ELD in the Gold Pass area below):
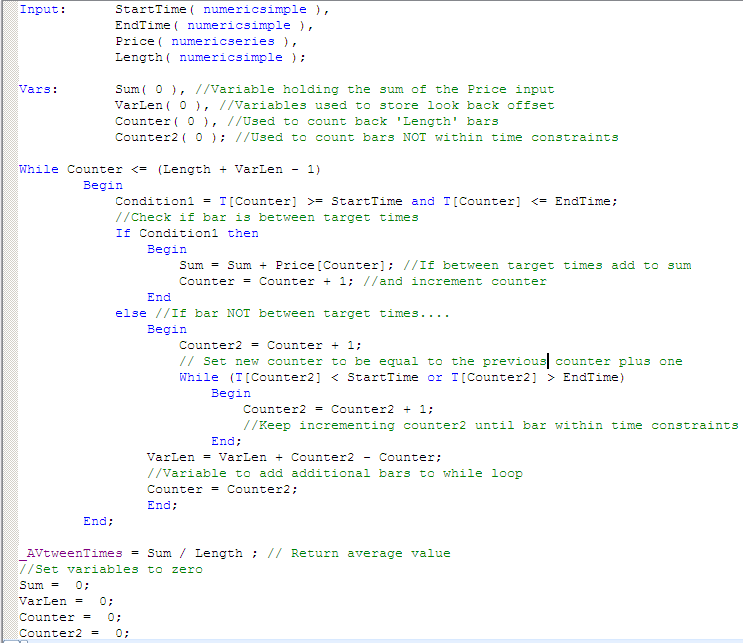
Press F3 to verify the code and correct any typos.
The program works as follows:
- It starts looking backwards, testing whether the time of each bar falls between the StartTime and the EndTime. If it does, it adds its value to the Sum variable and increments the Counter variable. If not, it keeps looking backwards until it finds a time within the time range.
- If a bar is not within the time constraints, the program increments the Counter2 variable.
- All the variables are set to zero after the result is passed back to the indicator.
I have added some comments to the program to help in its understanding.
Step 2 – Create a test indicator to access the function
Create a new indicator (click File – New- Window, select the EasyLanguage tab and click Indicator) and enter the following code:
Plot1( _AVtweenTimes( 1154, 1210, V, 20 ), "test", cyan );
Plot2( V, "-v", blue );
Step 3 – Apply to Chart
Open and new chart and apply the indicator (Insert – Indicator, select the indicator that you just created and MAKE SURE that the Prompt for Format check box is selected.
You will then see the following screen:
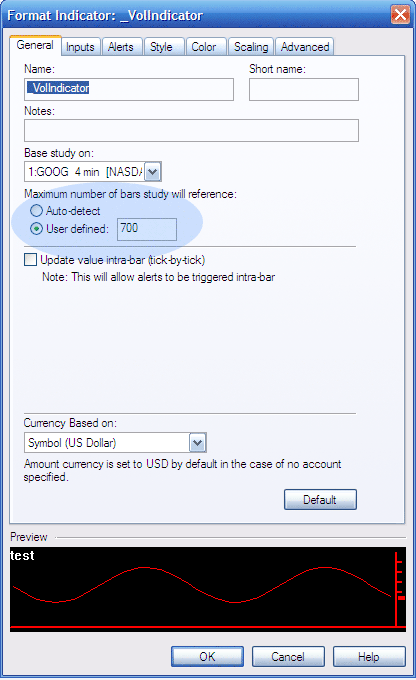
I added the blue oval to highlight the Maximum Number of Bars Study will Reference or MaxBarsBack settings. As I mentioned above, for this function to work correctly it is imperative that the MaxBarsBack is set correctly. To calculate what the setting should be, divide the Length setting that you are using by the number of bars between the StartTime and the EndTime. Multiply the result by the number of bars per day. MaxBarsBack controls the number of bars that need to be on the chart before an indicator or strategy starts to calculate.
Once applied the chart should look like this:
The cyan line shows the indicator just created and the blue line is a plot of volume. Notice how the cyan line changes during the time period that we specified and then stays horizontal.
Gold Pass download area (make sure you are logged in)
TO THE BEST OF MARKPLEX CORPORATION’S KNOWLEDGE, ALL OF THE INFORMATION ON THIS PAGE IS CORRECT, AND IT IS PROVIDED IN THE HOPE THAT IT WILL BE USEFUL. HOWEVER, MARKPLEX CORPORATION ASSUMES NO LIABILITY FOR ANY DAMAGES, DIRECT OR OTHERWISE, RESULTING FROM THE USE OF THIS INFORMATION AND/OR PROGRAM(S) DESCRIBED, AND NO WARRANTY IS MADE REGARDING ITS ACCURACY OR COMPLETENESS. USE OF THIS INFORMATION AND/OR PROGRAMS DESCRIBED IS AT YOUR OWN RISK.
ANY EASYLANGUAGE OR POWERLANGUAGE TRADING STRATEGIES, SIGNALS, STUDIES, INDICATORS, SHOWME STUDIES, PAINTBAR STUDIES, PROBABILITYMAP STUDIES, ACTIVITYBAR STUDIES, FUNCTIONS (AND PARTS THEREOF) AND ASSOCIATED TECHNIQUES REFERRED TO, INCLUDED IN OR ATTACHED TO THIS TUTORIAL OR PROGRAM DESCRIPTION ARE EXAMPLES ONLY, AND HAVE BEEN INCLUDED SOLELY FOR EDUCATIONAL PURPOSES. MARKPLEX CORPORATION. DOES NOT RECOMMEND THAT YOU USE ANY SUCH TRADING STRATEGIES, SIGNALS, STUDIES, INDICATORS, SHOWME STUDIES, PAINTBAR STUDIES, PROBABILITYMAP STUDIES, ACTIVITYBAR STUDIES, FUNCTIONS (OR ANY PARTS THEREOF) OR TECHNIQUES. THE USE OF ANY SUCH TRADING STRATEGIES, SIGNALS, STUDIES, INDICATORS, SHOWME STUDIES, PAINTBAR STUDIES, PROBABILITYMAP STUDIES, ACTIVITYBAR STUDIES, FUNCTIONS AND TECHNIQUES DOES NOT GUARANTEE THAT YOU WILL MAKE PROFITS, INCREASE PROFITS, OR MINIMIZE LOSSES.
If you see any errors in this tutorial – or I have not made something clear, I would be most grateful if you could please contact Markplex. Also, let me know if you have any ideas for new tutorials.