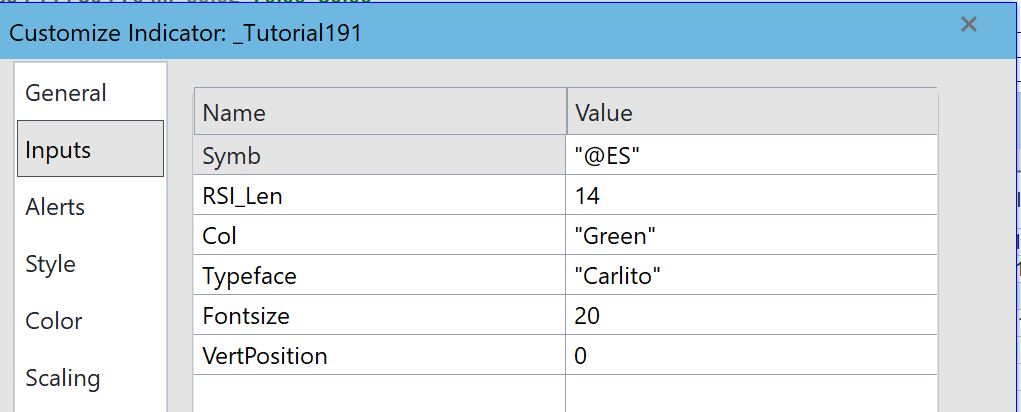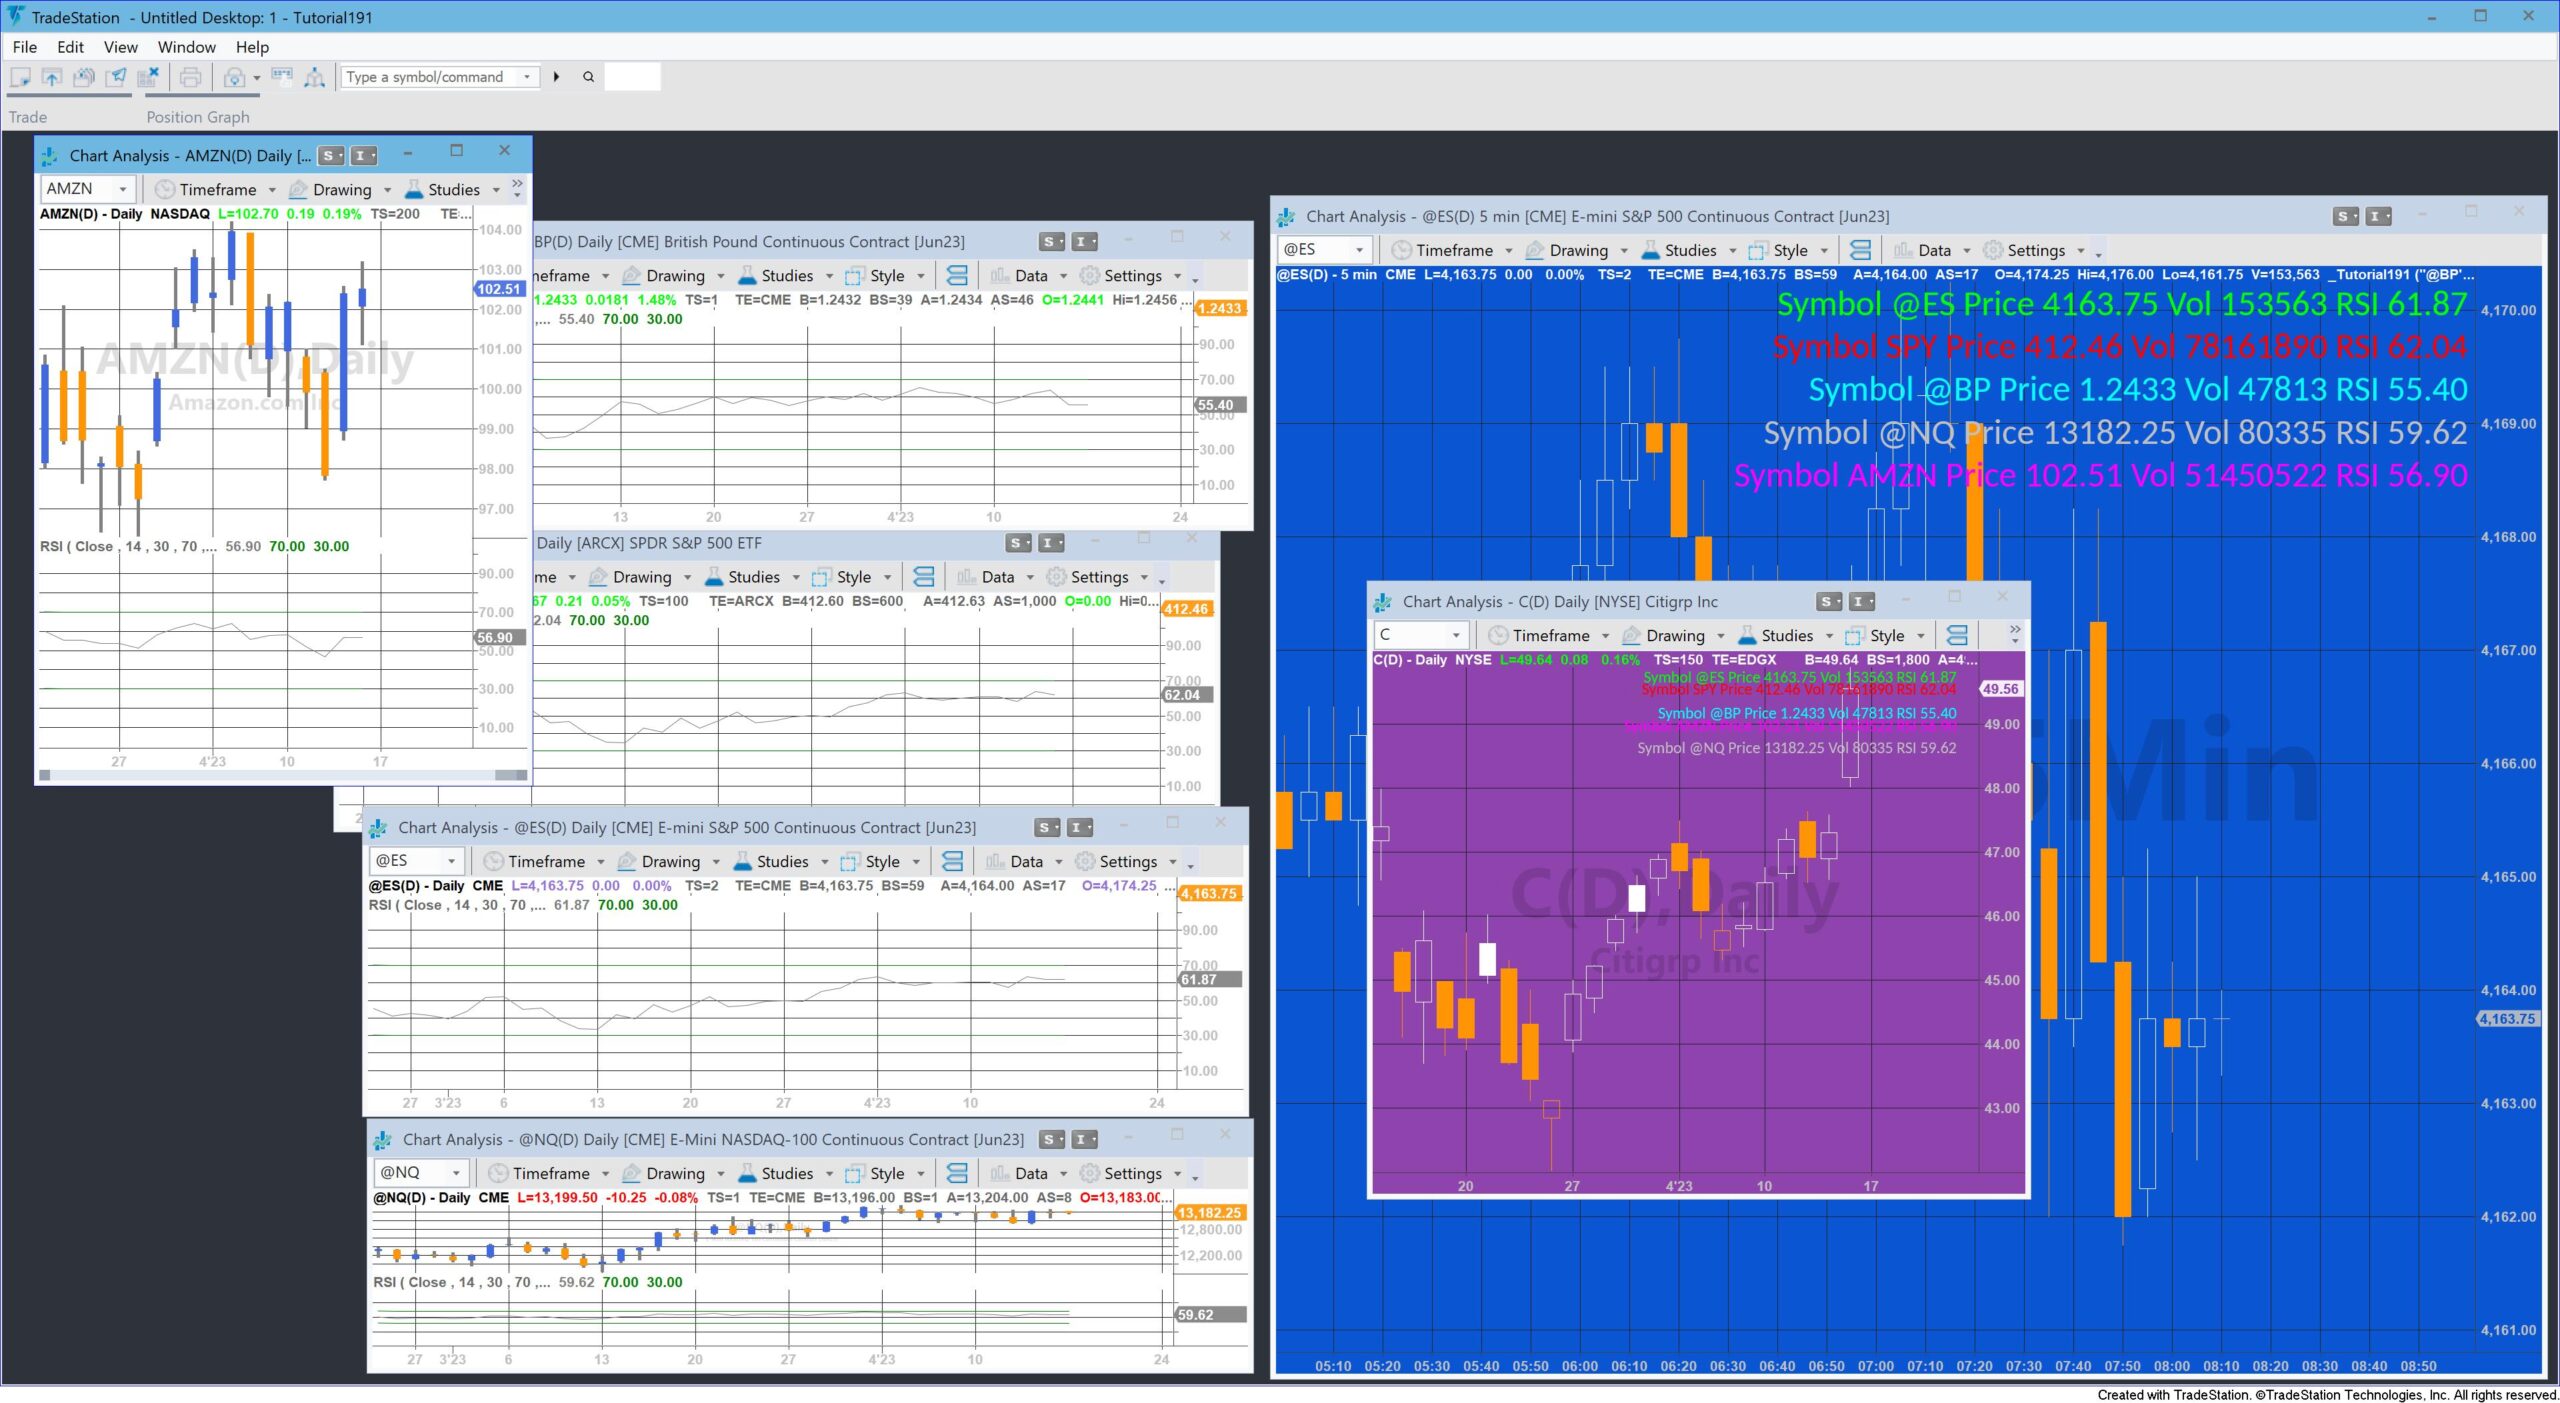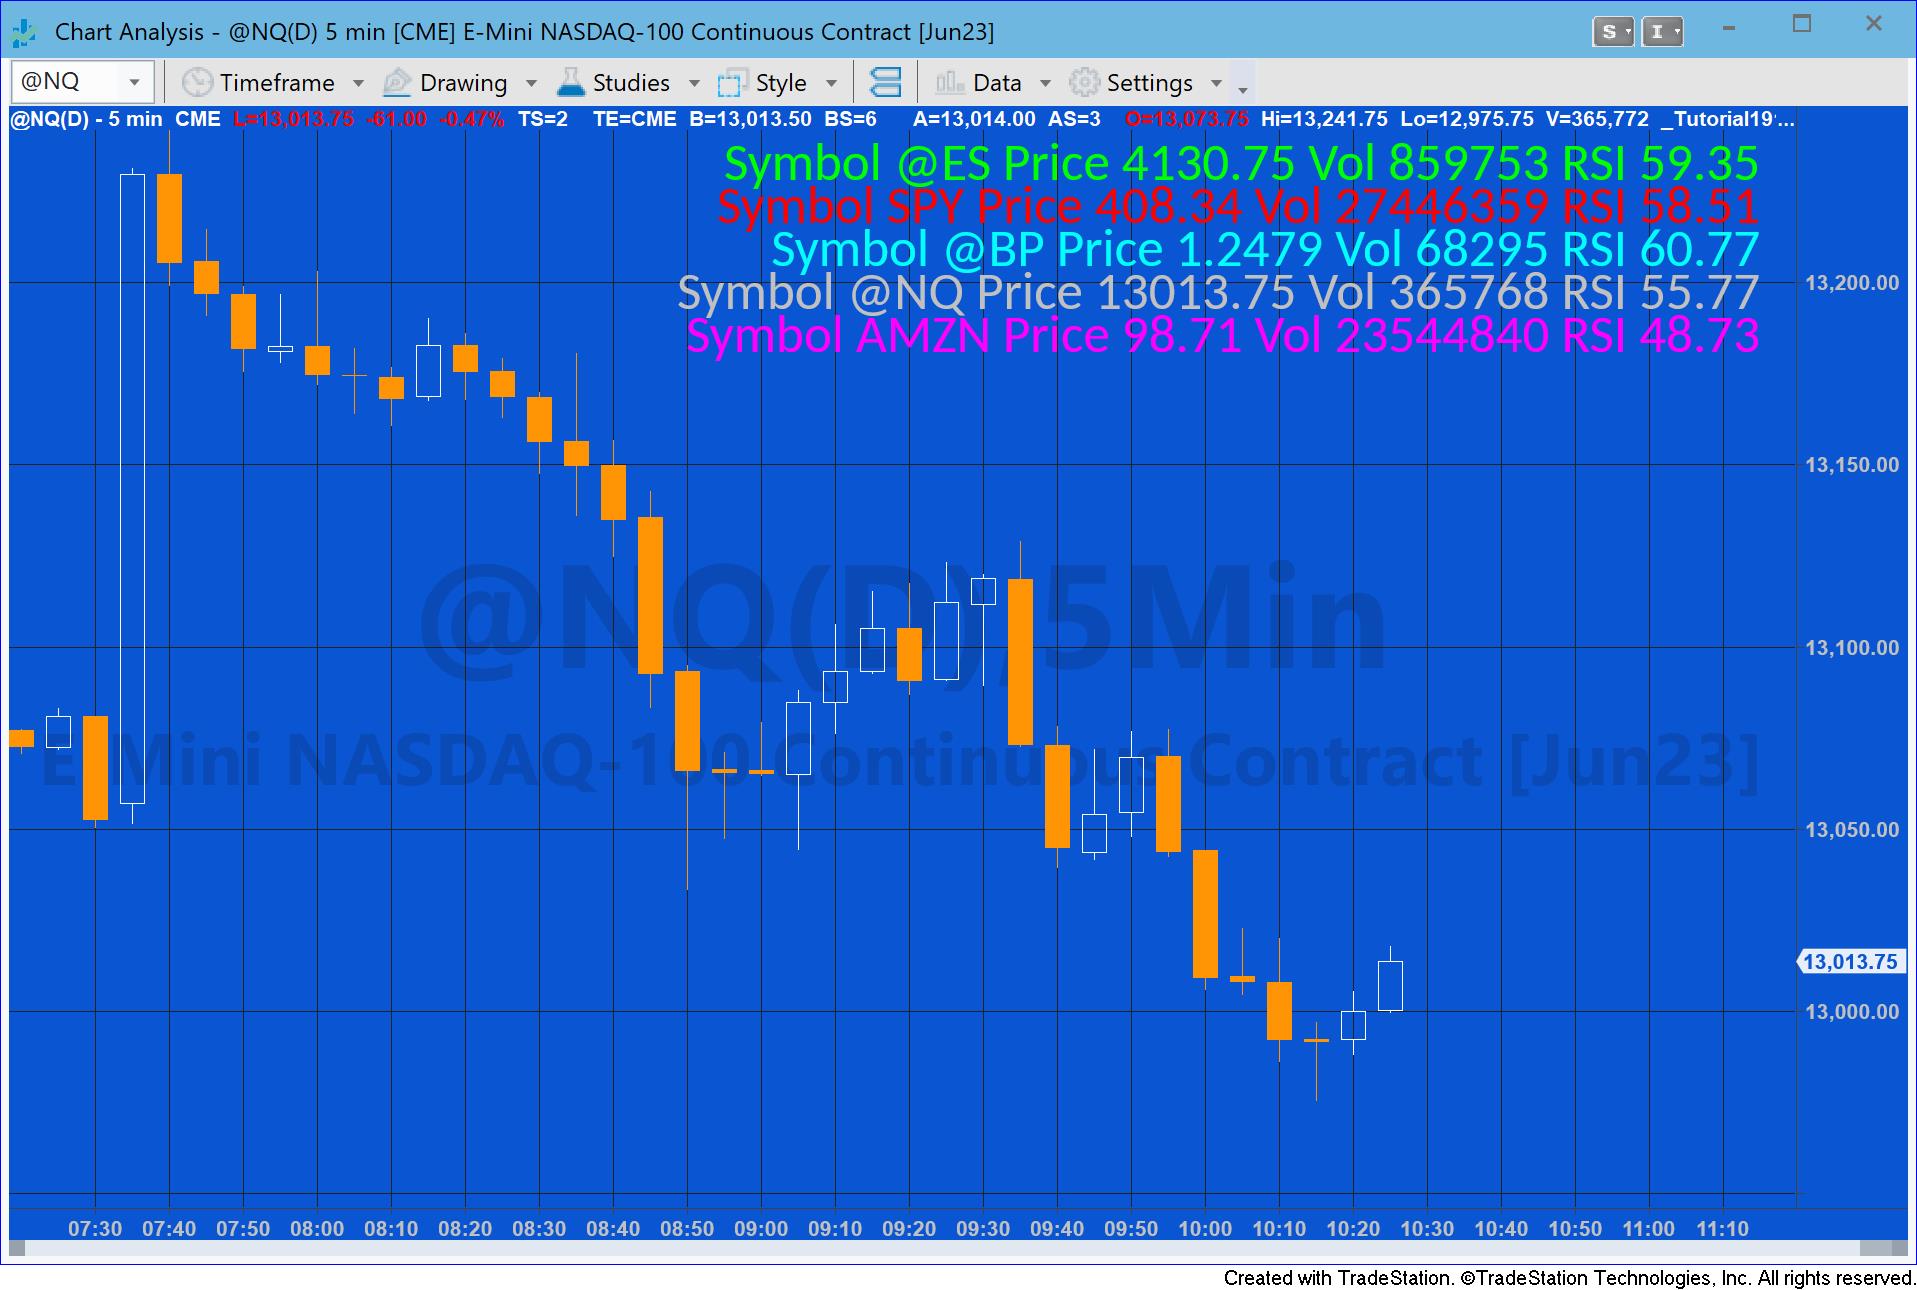
Tutorial 191 demonstrates how to create a program to display a panel of information about another symbol.
The information displayed includes the symbol name, closing price, daily volume and the Relative Strength Index (RSI) calculated using daily data from a Price Series Provider (PSP). In this example the indicator is applied 5 times as part of a ‘study group.’
The program uses the PSP to provide the data for a symbol different from the charted symbol. The tutorial also demonstrates a way of calculating the RSI value using this PSP data.

Explanation of tutorial 191
Overview and summary of the tutorial code
Tutorial 191 demonstrates how to create a program to display a panel of information about another symbol. The information displayed includes the symbol name, closing price, daily volume and the Relative Strength
Index (RSI) calculated using daily data. The program uses the Price Series Provider (PSP) to provide the data for another symbol. The tutorial also demonstrates a way of calculating the RSI value using this PSP data.
The PSP was initially setup by dragging the PSP component from the toolbox into the component tray. The various values were then modified and ‘update’ and ‘state changed’ events were created. Finally the code that
had been automatically generated in the designer generated code was copied into the program. The setup of the PSP was put in a ‘Once’ statement. The update event was modified to calculate an update for the RSI value for each new price tick.
A method to draw the text label was created in a similar way. The label was originally dragged from the toolbox into the component tray and then the code copied from the designer generated code.
The main calculation of the RSI is done when there is sufficient data in the PSP. For symbols where the last date on the chart is the current data the calculation is done for all the bars except for the last bar. The RSI is then recalculated and updated for each new tick in the PSP.
For symbols where the last date on the chart is not the current date, all the PSP bars are used to calculate the RSI.
Finally, with each tick the position of the label is checked and adjusted to ensure that it stays in the same place relative to the top right hand corner of the chart.
The tutorial program is designed to run on continuous symbols.
The tutorial is NOT compatible with MultiCharts.

TO THE BEST OF MARKPLEX CORPORATION’S KNOWLEDGE, ALL OF THE INFORMATION ON THIS PAGE IS CORRECT, AND IT IS PROVIDED IN THE HOPE THAT IT WILL BE USEFUL. HOWEVER, MARKPLEX CORPORATION ASSUMES NO LIABILITY FOR ANY DAMAGES, DIRECT OR OTHERWISE, RESULTING FROM THE USE OF THIS INFORMATION AND/OR PROGRAM(S) DESCRIBED, AND NO WARRANTY IS MADE REGARDING ITS ACCURACY OR COMPLETENESS. USE OF THIS INFORMATION AND/OR PROGRAMS DESCRIBED IS AT YOUR OWN RISK.
ANY EASYLANGUAGE OR POWERLANGUAGE TRADING STRATEGIES, SIGNALS, STUDIES, INDICATORS, SHOWME STUDIES, PAINTBAR STUDIES, PROBABILITYMAP STUDIES, ACTIVITYBAR STUDIES, FUNCTIONS (AND PARTS THEREOF) AND ASSOCIATED TECHNIQUES REFERRED TO, INCLUDED IN OR ATTACHED TO THIS TUTORIAL OR PROGRAM DESCRIPTION ARE EXAMPLES ONLY, AND HAVE BEEN INCLUDED SOLELY FOR EDUCATIONAL PURPOSES. MARKPLEX CORPORATION. DOES NOT RECOMMEND THAT YOU USE ANY SUCH TRADING STRATEGIES, SIGNALS, STUDIES, INDICATORS, SHOWME STUDIES, PAINTBAR STUDIES, PROBABILITYMAP STUDIES, ACTIVITYBAR STUDIES, FUNCTIONS (OR ANY PARTS THEREOF) OR TECHNIQUES. THE USE OF ANY SUCH TRADING STRATEGIES, SIGNALS, STUDIES, INDICATORS, SHOWME STUDIES, PAINTBAR STUDIES, PROBABILITYMAP STUDIES, ACTIVITYBAR STUDIES, FUNCTIONS AND TECHNIQUES DOES NOT GUARANTEE THAT YOU WILL MAKE PROFITS, INCREASE PROFITS, OR MINIMIZE LOSSES.


