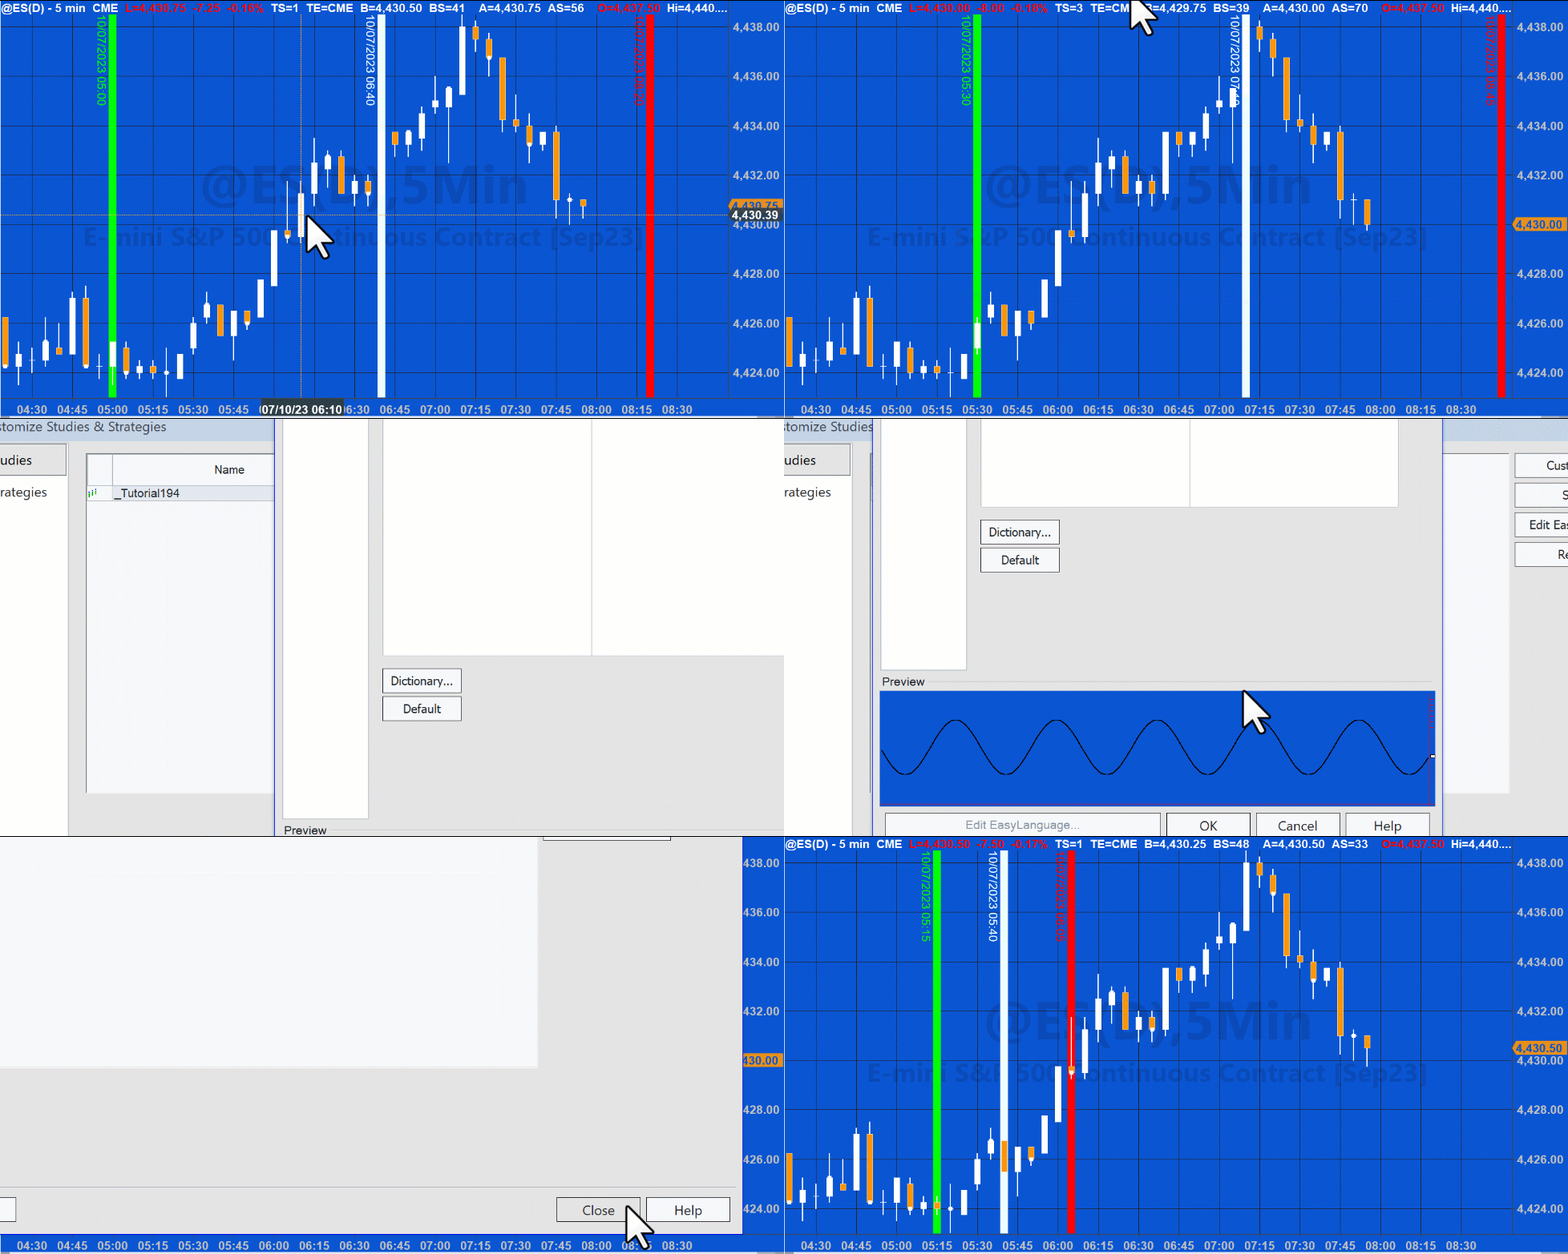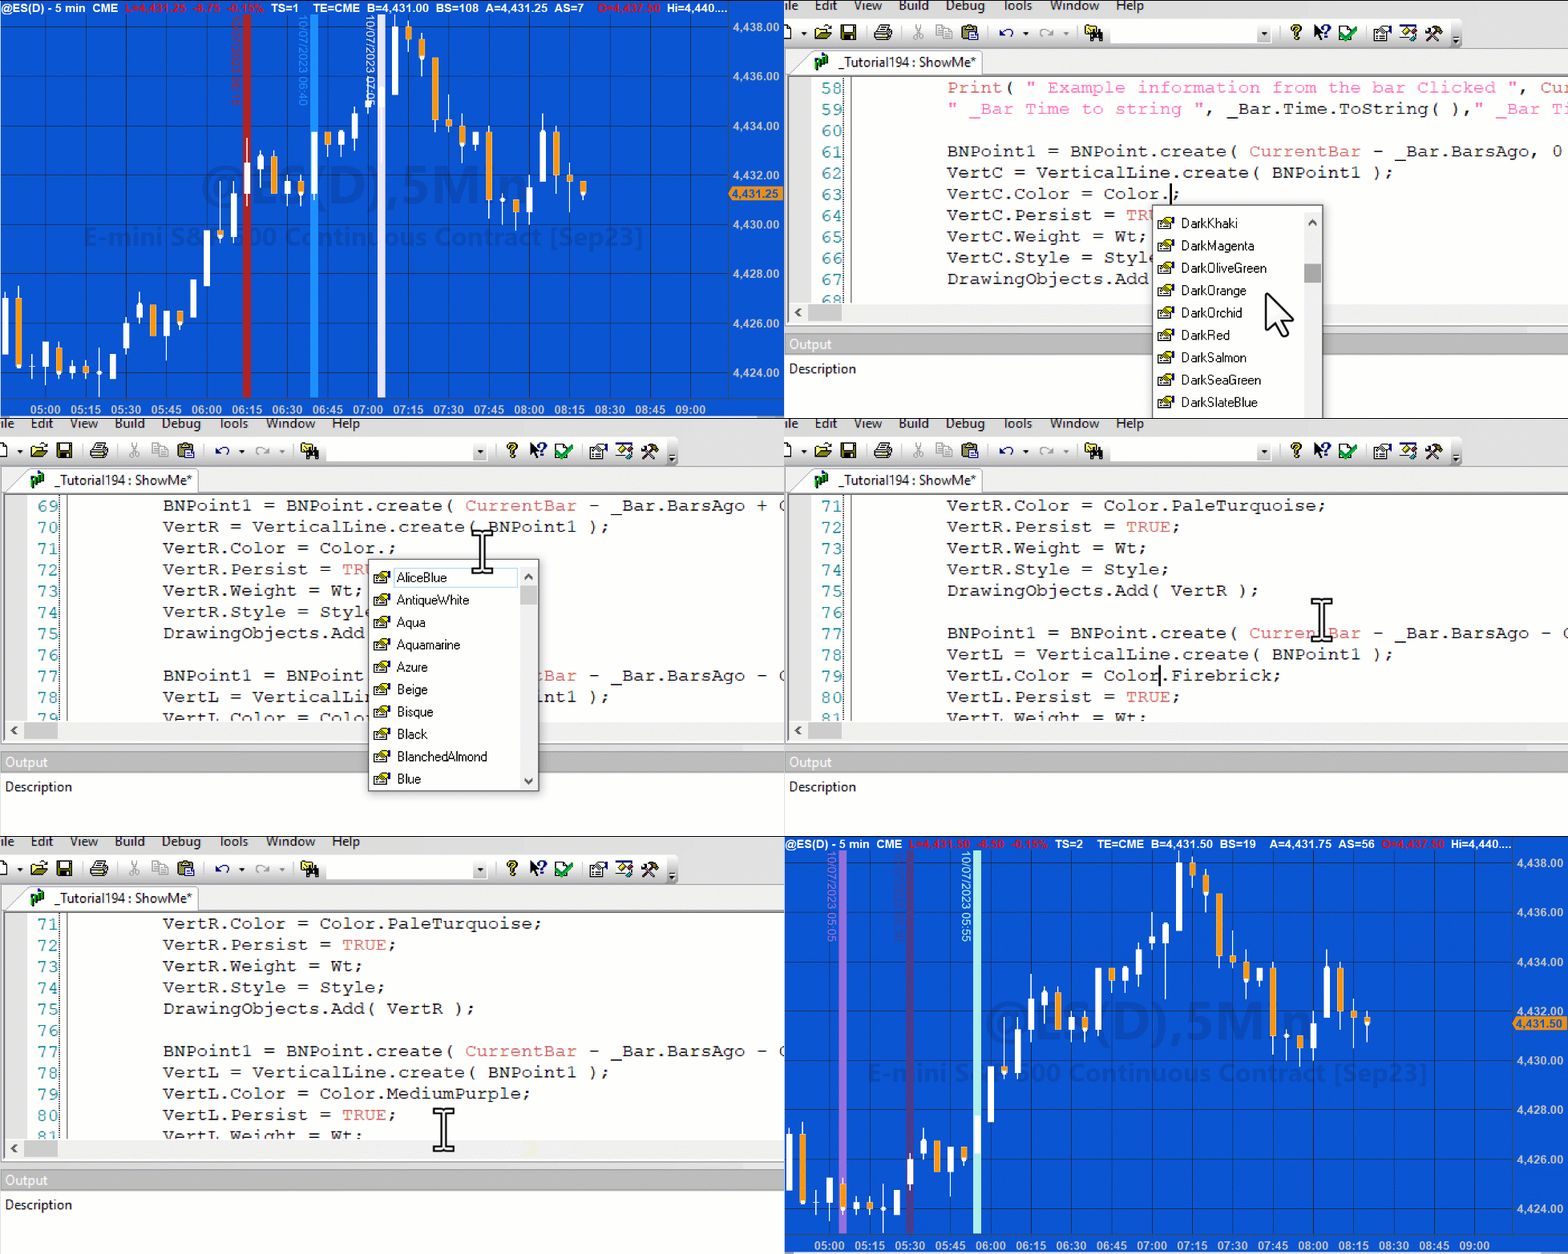
A Gold Pass Member asked how he would go about drawing vertical lines, 26 bars left and 26 bars right from a bar chosen by a mouse click.
Such an analysis technique needs three elements:
1) To be able to detect when a bar is clicked on the chart
2) To clear vertical lines drawn when a previous bar was clicked
3) To create and draw vertical line drawing objects
In this tutorial, rather than hard-coding the number of bars before and after the bar clicked, the number is determined by a user input (Gap) as are the weight and thickness of the vertical lines.
The colors of the lines are hard-coded but could easily be changed (see the tutorial video).
Technical lessons include:
- Using the ChartingHost class to determine when a bar is clicked
- Creating BNPoints for the bars where we draw Vertical lines
- Clearing and adding VerticalLines to the chart
- Modifying the weight and style of the vertical lines
Explanation of tutorial 194
Free Gold Pass download of the tutorial 194 code
If you are a Gold Pass member you can download the tutorial 194 program for free. (Make sure that you are logged into Gold Pass): ![]() This content is for members only.
This content is for members only.
Download the tutorial program
The tutorial is NOT compatible with MultiCharts.
TO THE BEST OF MARKPLEX CORPORATION’S KNOWLEDGE, ALL OF THE INFORMATION ON THIS PAGE IS CORRECT, AND IT IS PROVIDED IN THE HOPE THAT IT WILL BE USEFUL. HOWEVER, MARKPLEX CORPORATION ASSUMES NO LIABILITY FOR ANY DAMAGES, DIRECT OR OTHERWISE, RESULTING FROM THE USE OF THIS INFORMATION AND/OR PROGRAM(S) DESCRIBED, AND NO WARRANTY IS MADE REGARDING ITS ACCURACY OR COMPLETENESS. USE OF THIS INFORMATION AND/OR PROGRAMS DESCRIBED IS AT YOUR OWN RISK.
ANY EASYLANGUAGE OR POWERLANGUAGE TRADING STRATEGIES, SIGNALS, STUDIES, INDICATORS, SHOWME STUDIES, PAINTBAR STUDIES, PROBABILITYMAP STUDIES, ACTIVITYBAR STUDIES, FUNCTIONS (AND PARTS THEREOF) AND ASSOCIATED TECHNIQUES REFERRED TO, INCLUDED IN OR ATTACHED TO THIS TUTORIAL OR PROGRAM DESCRIPTION ARE EXAMPLES ONLY, AND HAVE BEEN INCLUDED SOLELY FOR EDUCATIONAL PURPOSES. MARKPLEX CORPORATION. DOES NOT RECOMMEND THAT YOU USE ANY SUCH TRADING STRATEGIES, SIGNALS, STUDIES, INDICATORS, SHOWME STUDIES, PAINTBAR STUDIES, PROBABILITYMAP STUDIES, ACTIVITYBAR STUDIES, FUNCTIONS (OR ANY PARTS THEREOF) OR TECHNIQUES. THE USE OF ANY SUCH TRADING STRATEGIES, SIGNALS, STUDIES, INDICATORS, SHOWME STUDIES, PAINTBAR STUDIES, PROBABILITYMAP STUDIES, ACTIVITYBAR STUDIES, FUNCTIONS AND TECHNIQUES DOES NOT GUARANTEE THAT YOU WILL MAKE PROFITS, INCREASE PROFITS, OR MINIMIZE LOSSES.


