
In a previous tutorial, I describe a step by step guide to create a simple ShowMe study to highlight ‘inside bars’. The result, when applied to a chart, should have appeared something like the following screen grab:
TO THE BEST OF MARKPLEX CORPORATION’S KNOWLEDGE, ALL OF THE INFORMATION ON THIS PAGE IS CORRECT, AND IT IS PROVIDED IN THE HOPE THAT IT WILL BE USEFUL. HOWEVER, MARKPLEX CORPORATION ASSUMES NO LIABILITY FOR ANY DAMAGES, DIRECT OR OTHERWISE, RESULTING FROM THE USE OF THIS INFORMATION AND/OR PROGRAM(S) DESCRIBED, AND NO WARRANTY IS MADE REGARDING ITS ACCURACY OR COMPLETENESS. USE OF THIS INFORMATION AND/OR PROGRAMS DESCRIBED IS AT YOUR OWN RISK.
ANY EASYLANGUAGE OR POWERLANGUAGE TRADING STRATEGIES, SIGNALS, STUDIES, INDICATORS, SHOWME STUDIES, PAINTBAR STUDIES, PROBABILITYMAP STUDIES, ACTIVITYBAR STUDIES, FUNCTIONS (AND PARTS THEREOF) AND ASSOCIATED TECHNIQUES REFERRED TO, INCLUDED IN OR ATTACHED TO THIS TUTORIAL OR PROGRAM DESCRIPTION ARE EXAMPLES ONLY, AND HAVE BEEN INCLUDED SOLELY FOR EDUCATIONAL PURPOSES. MARKPLEX CORPORATION. DOES NOT RECOMMEND THAT YOU USE ANY SUCH TRADING STRATEGIES, SIGNALS, STUDIES, INDICATORS, SHOWME STUDIES, PAINTBAR STUDIES, PROBABILITYMAP STUDIES, ACTIVITYBAR STUDIES, FUNCTIONS (OR ANY PARTS THEREOF) OR TECHNIQUES. THE USE OF ANY SUCH TRADING STRATEGIES, SIGNALS, STUDIES, INDICATORS, SHOWME STUDIES, PAINTBAR STUDIES, PROBABILITYMAP STUDIES, ACTIVITYBAR STUDIES, FUNCTIONS AND TECHNIQUES DOES NOT GUARANTEE THAT YOU WILL MAKE PROFITS, INCREASE PROFITS, OR MINIMIZE LOSSES.
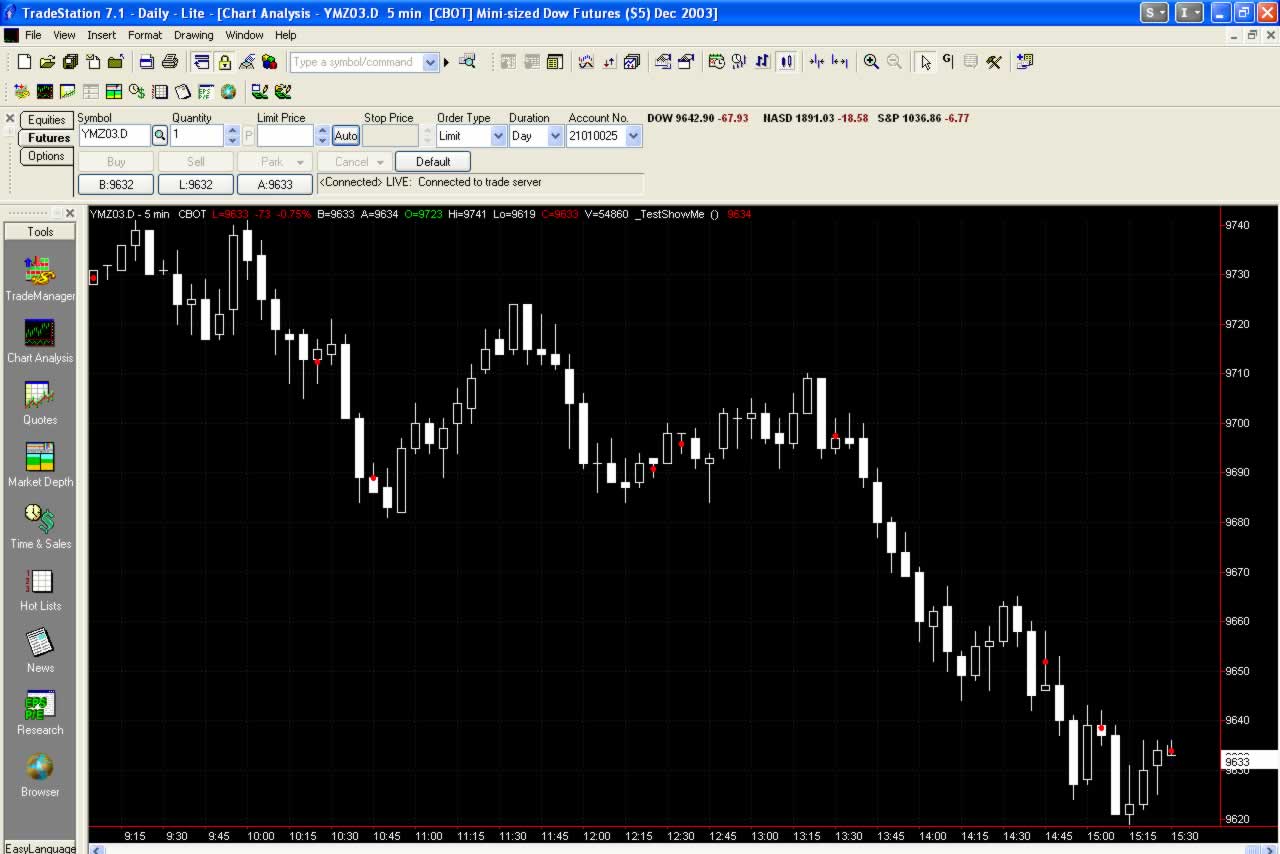
As I mentioned before, you will notice that red dots appear between the high and low of ‘inside bars’. BEWARE: You may notice that there seems to be an anomaly. If you let the chart develop during the day, some dots may appear on bars that are blatantly not inside bars. This tutorial gives an explanation of why this is happening and how to avoid it.
Step 1.
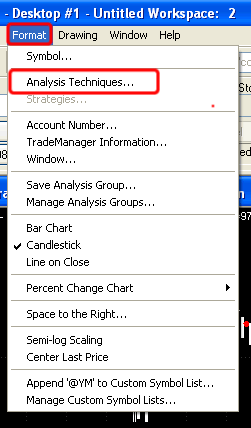
When applying studies (show-me studies, indicators etc) to charts, you are given various options. With the chart open and the show-me study applied, click on Format – Analysis Techniques.
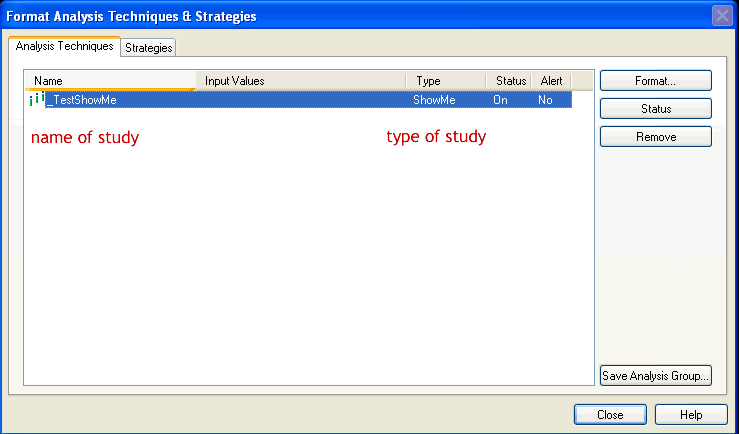
You will then get the following screen:
Step 2
Click on Format and you will see the following options:
Step 3
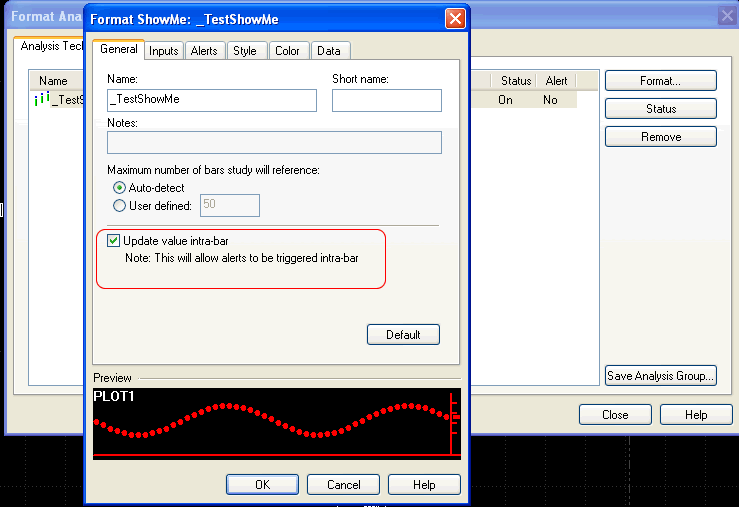
I have circled the Update value intrabar option. If this option is not selected then the ShowMe study is calculated at the completion of the bar – in other words, in our case, if the bar is an inside bar when the bar closes then a red dot will be added to the chart. If the bar does not fulfill the ‘inside bar’ condition at the end of the bar – then nothing is plotted.
If this is option is selected then the study is recalculated WITHIN the bar. Practically speaking, this means that with the study as it is currently written, if the ‘inside bar’ condition occurs during the formation of the bar – then a red dot will be plotted, The red dot will remain on the chart – even if the condition is no longer in force when the bar closes.
Step 4
Both update options can be useful, but lets say that you require to update the study values intrabar, but you want to avoid plots that are no longer accurate. In this case you would select the Update value intrabar option and modify the simple ShowMe that we wrote, as follows, using the NoPlot(Num) statement:
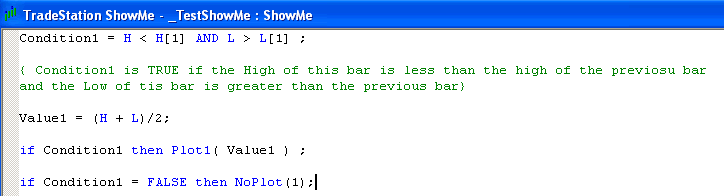
If during the bar Condition1 is no longer true, then the plot is removed from the chart.
By using this technique it is possible to have your indicators appear without having to wait until the bar has fully formed, while at the same time removing any ‘spurious’ indicators.