
Welcome to tutorial 20 in this series of tutorials to help you learn TradeStation EasyLanguage programming skills. The idea behind the series is that if you can program with TradeStation EasyLanguage yourself, you will have a skill that will enable you to try out trading ideas without the need to use a professional programmer.
As always, the purpose of this tutorial is to demonstrate the programming techniques rather than to create a tradable indicator. This tutorial was created using TradeStation version 8.6.
TO THE BEST OF MARKPLEX CORPORATION’S KNOWLEDGE, ALL OF THE INFORMATION ON THIS PAGE IS CORRECT, AND IT IS PROVIDED IN THE HOPE THAT IT WILL BE USEFUL. HOWEVER, MARKPLEX CORPORATION ASSUMES NO LIABILITY FOR ANY DAMAGES, DIRECT OR OTHERWISE, RESULTING FROM THE USE OF THIS INFORMATION AND/OR PROGRAM(S) DESCRIBED, AND NO WARRANTY IS MADE REGARDING ITS ACCURACY OR COMPLETENESS. USE OF THIS INFORMATION AND/OR PROGRAMS DESCRIBED IS AT YOUR OWN RISK.
ANY EASYLANGUAGE OR POWERLANGUAGE TRADING STRATEGIES, SIGNALS, STUDIES, INDICATORS, SHOWME STUDIES, PAINTBAR STUDIES, PROBABILITYMAP STUDIES, ACTIVITYBAR STUDIES, FUNCTIONS (AND PARTS THEREOF) AND ASSOCIATED TECHNIQUES REFERRED TO, INCLUDED IN OR ATTACHED TO THIS TUTORIAL OR PROGRAM DESCRIPTION ARE EXAMPLES ONLY, AND HAVE BEEN INCLUDED SOLELY FOR EDUCATIONAL PURPOSES. MARKPLEX CORPORATION. DOES NOT RECOMMEND THAT YOU USE ANY SUCH TRADING STRATEGIES, SIGNALS, STUDIES, INDICATORS, SHOWME STUDIES, PAINTBAR STUDIES, PROBABILITYMAP STUDIES, ACTIVITYBAR STUDIES, FUNCTIONS (OR ANY PARTS THEREOF) OR TECHNIQUES. THE USE OF ANY SUCH TRADING STRATEGIES, SIGNALS, STUDIES, INDICATORS, SHOWME STUDIES, PAINTBAR STUDIES, PROBABILITYMAP STUDIES, ACTIVITYBAR STUDIES, FUNCTIONS AND TECHNIQUES DOES NOT GUARANTEE THAT YOU WILL MAKE PROFITS, INCREASE PROFITS, OR MINIMIZE LOSSES.
Analysis Commentary is a useful Tradestation feature that enables you to create an EasyLanguage program or part of an EasyLanguage program that only runs when a bar is clicked using the Analysis Commentary pointer. This opens a window which displays the information whose output you have programmed.
Its probably easier to demonstrate by example, and so in this tutorial we will first create a very simple commentary program. We will then go on to create something more complicated using Analysis Commentary’s HTML capabilities.
Step 1 – Create a simple ShowMe study
Create a new ShowMe study by clicking File – New – Window and when a window appears, selecting the EasyLanguage tab. Click on ShowMe followed by OK. Enter a name for the ShowMe, e.g. _tutorial20-1 and click OK.
Enter the following code:
Press F3 or click the verify button to verify the code and correct any typos.
Open a new chart and apply the ShowMe to the chart by clicking Insert – ShowMe.
The chart should look no different from what it did before you applied the ShowMe. Now click the Analysis Commentary button on the icon bar at the top of the screen, I have circled it in the following screen capture:
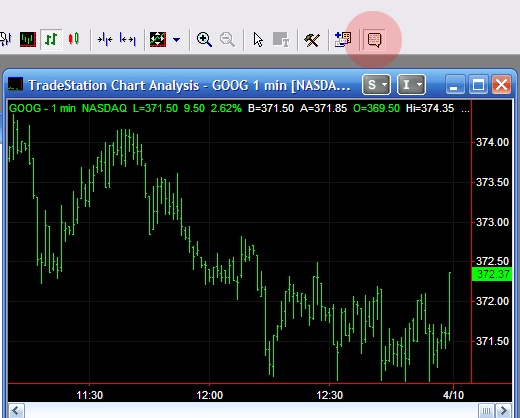
Having done this your pointer will now have the Analysis Commentary icon showing next to it. If you now click on one of the bars you should see something like the following:
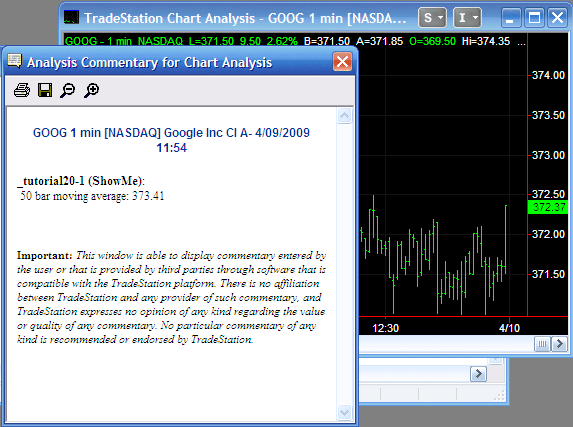
Obviously this is a very simple example. You could add significantly more information into the commentary statement and one of the benefits of using Analysis Commentary is that the calculation included in the Commentary statement is only run when you click the Analysis Commentary button AND click a bar on the chart.
Step 2 – Using AtCommentaryBar or CommentaryEnabled
I mentioned in Step 1 that the calculation (in our case Average(C,50)) only occurs when you click the Analysis Commentary button AND click a bar on the chart. But what is you wanted to run additional statements when a bar was clicked? This can be achieved by using AtCommentaryBar or CommentaryEnabled. They work as follows:
If AtCommentBar is included in a program, it evaluates to TRUE for the bar that is clicked with the Analysis Commentary pointer. If CommentaryEnabled is used, when a bar is clicked with the Analysis Commentary pointer then CommentaryEnabled evaluates as true for all bars.
We can demonstrate this as follows. Modify the ShowMe that you already created to:
Commentary(” 50 bar moving average: “,Average(C,50));
Plot1(C);
End;
(Note that “If AtCommentaryBar” is shorthand for “If AtCommentaryBar = TRUE.”)
Go back to your chart, click the Analysis Commentary button on the icon bar at the top of the screen and click a bar on the chart. Your screen should look similar to this:
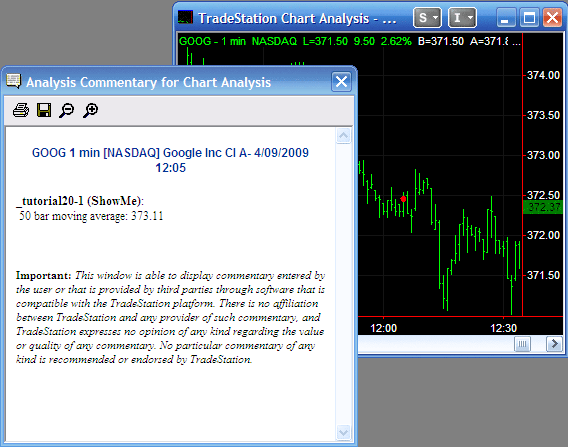
Notice that this looks very much like the previous example, except this time we have plotted a single dot on the bar that we clicked. This is because this is the only bar where “If AtCommentaryBar” has evaluated to true. You could test this by adding a print statement, as follows:
Commentary(” 50 bar moving average: “,Average(C,50));
Plot1(C);
End;
Print(D,T,AtCommentaryBar);
Since the print statement is outside of the “If” statement it is evaluated on every bar. If you look at the print log you should see outlook similar to the following (assuming that you clicked on the 12:05 bar):
……
1090409.001202.00 FALSE
1090409.001203.00 FALSE
1090409.001204.00 FALSE
1090409.001205.00 TRUE
1090409.001206.00 FALSE
1090409.001207.00 FALSE
1090409.001208.00 FALSE
1090409.001209.00 FALSE
…….
Now modify our simple program, thus:
Commentary(” 50 bar moving average: “,Average(C,50));
Plot1(C);
End;
Print(D,T,CommentaryEnabled);
Verify the program and look at the chart.
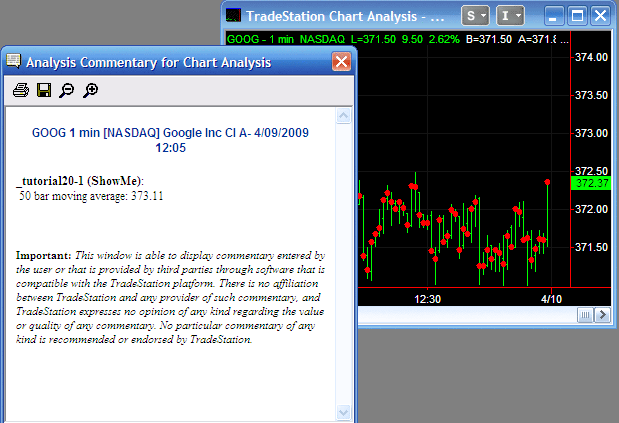
Notice that the Analysis Commentary window appears as before with information about the bar that was clicked, BUT we now have a plot on every bar. This is because CommentaryEnabled evaluates as TRUE for every bar as soon as we click on a bar using the Analysis Commentary pointer.
Step 3 – Create a new program using Analysis Commentary HTML
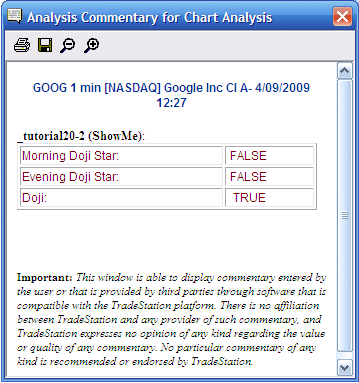
We will now create a new program that will create an Analysis Commentary that shows whether three common Candlestick patterns are true for a specific bar. The information is presented in an HTML table. Once created the program should create an Analysis Commentary like the following window:
Enter the code as follows:
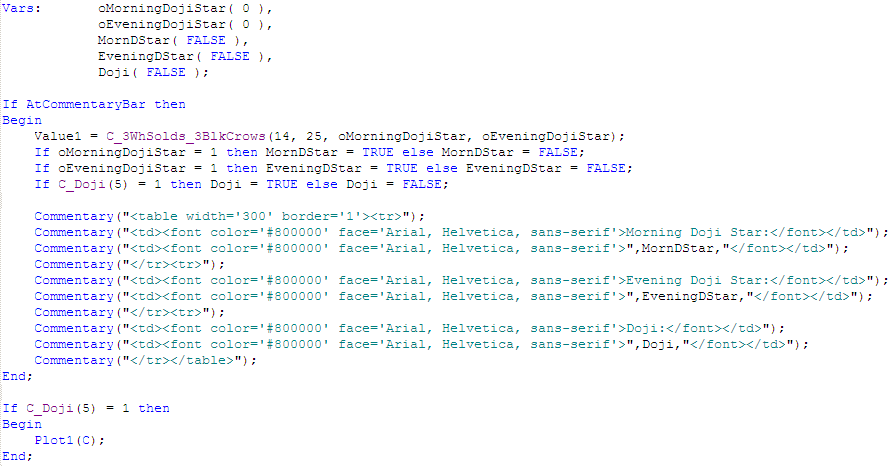
I have not added comments, in order to save space, but adding comments (i.e information about the program, that doesn’t affect the running of the program) is good practice.
In the above program, we have used the C_3WhSolds_3BlkCrows function. This requires us to create the two variables: oMorningDojiStar and oEveningDojiStar. We are using the AtCommentaryBar syntax, so the items within the “if statement” are only evaluated for the the bar that we click.
In both the case of the C_3WhSolds_3BlkCrows function and the C_Doji function I test if they are equal to 1 and, if so, set another variable to TRUE, if not I set it to FALSE. These variables are used in the table.
Note the HTML code that produces the table. HTML is what is commonly used for Web design. The syntax for a simple table is:
<table>
<tr>
<td>First cell</td><td>Second cell</td>
</tr>
<tr>
<td>First cell on second row </td><td>Second cell on second row </td>
</tr>
</table>
The coding in the actual program is slightly more complicated because I added color and font attributes for the text in the cell, as follows:
<font color=’#800000′ face=’Arial, Helvetica, sans-serif’>
Notice that since the Commentary statement is included within double quotes, I have used single quotes in the HTML.
If you are structuring very complex HTML it would make sense to use a program such as Adobe DreamWeaver to create the HTML and then to copy it into TradeStation.
Conclusion
Thia tutorial aims to help in the understanding of the Analysis Commentary windows and some of the possibilities it offers, especially in terms of formatting using HTML.