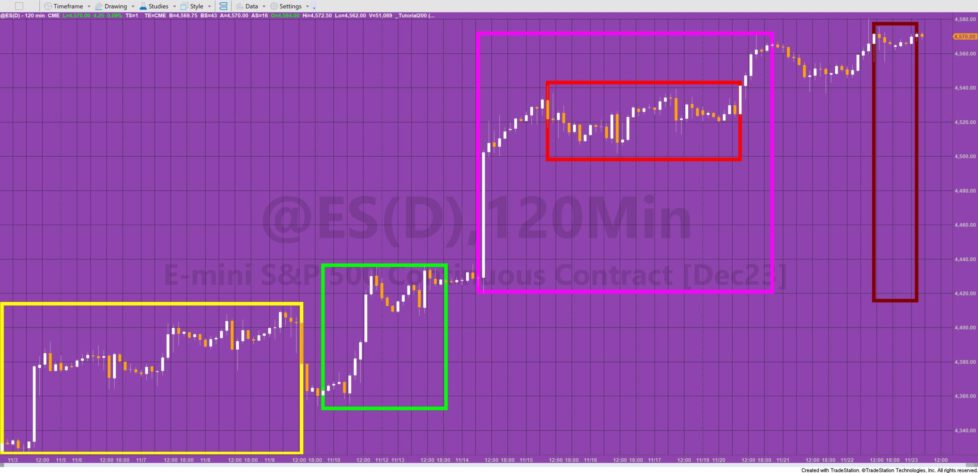
A Markplex.com subscriber uses the Fibonacci retracement lines (a standard TradeStation drawing tool) to analyze his charts. This results in several Fibonacci retracement lines drawn on several charts. He wanted a way of storing price level details as well as the start and end date/times. This is the sort of thing that can normally be achieved by using data provided by the drawing object functionality. Unfortunately this data is not available for Fibonacci retracement lines drawing objects.
A simple alternative is to use the rectangle drawing tool. Obviously this does not include the Fibonacci levels, but these could be added programmatically. In this tutorial the program detects rectangles that are on the chart when the program is applied (or whose status is turned on) as well as rectangles that are added while the program is running.
Tutorial 200 uses the following ways of detecting rectangles:
- when the program is first applied to the Chart
- when the chart is clicked (using a ChartingHost chart up click event)
- using a Timer
- using a rectangle click event
When rectangle drawing objects are applied to the chart a method (named UpdatePrint) updates a vector containing all the hand drawn rectangles on the chart. This is achieved by using the drawingobjects.Items[8] syntax.
The UpdatePrint method makes sure that each rectangle has a click event associated with it. If a stream writer is already open, it is closed and a new Streamwriter is opened. Data about each rectangle is written to a CSV (comma separated values) file on the local computer using the Streamwriter.
The information written to the file is:
- the date and time of the most recent bar
- the color of each Rectangle
- the date and time of the the starting point of the rectangle
- the date and time of the end point of the rectangle
- the start time of the rectangle
- the end time of the rectangle
- the start price of the rectangle
- the end price of the rectangle
The location of where the file is saved is set as a user input. The file name is made up of “T200”, concatenated with the symbol name, the bar interval, and the date time of the first bar on the chart and the hours when the program was applied to the chart.
Tutorial 200 uses some of the same techniques used in tutorial 199.
Watch the video below for a full explanation.
Explanation of tutorial 200
Note that the following code was changed after I made the video.
BoxCol = ColorDict.Items[( list[ Ctr ] astype Rectangle ).Color.ToString( )] astype String
Else BoxCol = ( list[ Ctr ] astype Rectangle ).Color.ToString( );
Became:
BoxCol = ColorDict.Items[( list[ Ctr ] astype Rectangle ).Color.ToString( )] astype String
Else BoxCol = ( list[ Ctr ] astype Rectangle ).Color.Name; // Gets the hex representation of the color
I also didn’t explain what was going on in this part of the program:
For k = knownColor.AliceBlue to knownColor.DarkBrown begin
		print( k:0:0, "Color [A=", string.format("{0:D0}", ( Color.FromKnownColor( k ).A)),", R=", string.format("{0:D0}",(Color.FromKnownColor( k ).R)),", G=",
		string.format("{0:D0}",(Color.FromKnownColor( k ).G)),", B=", string.format("{0:D0}",(Color.FromKnownColor( k ).B)), "]", Color.FromKnownColor( k ).name );

		// Create Str containing ARGB data in "Color [A=255, R=128, G=128, B=0]"format
		str = "Color [A="+string.format("{0:D0}", ( Color.FromKnownColor( k ).A))+", R="+string.format("{0:D0}",(Color.FromKnownColor( k ).R))+", G="+
		string.format("{0:D0}",(Color.FromKnownColor( k ).G))+", B="+string.format("{0:D0}",(Color.FromKnownColor( k ).B))+"]";

		// If Str in not in the dictionary add it as key and the color name as value
		If ColorDict.Contains( Str ) = False then ColorDict.Add( Str, Color.FromKnownColor( k ).name );
	End;
I was using the Color.FromKnownColor( k ).R syntax to separate the alpha, red, green and blue components of the color to enable the creation of a string in the following format: Color [A=255, R=128, G=128, B=0], i.e. the same format output by Color.ToString( ) on line 159 of the tutorial program.

Example data opened in read-only spreadsheet file
TO THE BEST OF MARKPLEX CORPORATION’S KNOWLEDGE, ALL OF THE INFORMATION ON THIS PAGE IS CORRECT, AND IT IS PROVIDED IN THE HOPE THAT IT WILL BE USEFUL. HOWEVER, MARKPLEX CORPORATION ASSUMES NO LIABILITY FOR ANY DAMAGES, DIRECT OR OTHERWISE, RESULTING FROM THE USE OF THIS INFORMATION AND/OR PROGRAM(S) DESCRIBED, AND NO WARRANTY IS MADE REGARDING ITS ACCURACY OR COMPLETENESS. USE OF THIS INFORMATION AND/OR PROGRAMS DESCRIBED IS AT YOUR OWN RISK.
ANY EASYLANGUAGE OR POWERLANGUAGE TRADING STRATEGIES, SIGNALS, STUDIES, INDICATORS, SHOWME STUDIES, PAINTBAR STUDIES, PROBABILITYMAP STUDIES, ACTIVITYBAR STUDIES, FUNCTIONS (AND PARTS THEREOF) AND ASSOCIATED TECHNIQUES REFERRED TO, INCLUDED IN OR ATTACHED TO THIS TUTORIAL OR PROGRAM DESCRIPTION ARE EXAMPLES ONLY, AND HAVE BEEN INCLUDED SOLELY FOR EDUCATIONAL PURPOSES. MARKPLEX CORPORATION. DOES NOT RECOMMEND THAT YOU USE ANY SUCH TRADING STRATEGIES, SIGNALS, STUDIES, INDICATORS, SHOWME STUDIES, PAINTBAR STUDIES, PROBABILITYMAP STUDIES, ACTIVITYBAR STUDIES, FUNCTIONS (OR ANY PARTS THEREOF) OR TECHNIQUES. THE USE OF ANY SUCH TRADING STRATEGIES, SIGNALS, STUDIES, INDICATORS, SHOWME STUDIES, PAINTBAR STUDIES, PROBABILITYMAP STUDIES, ACTIVITYBAR STUDIES, FUNCTIONS AND TECHNIQUES DOES NOT GUARANTEE THAT YOU WILL MAKE PROFITS, INCREASE PROFITS, OR MINIMIZE LOSSES.

