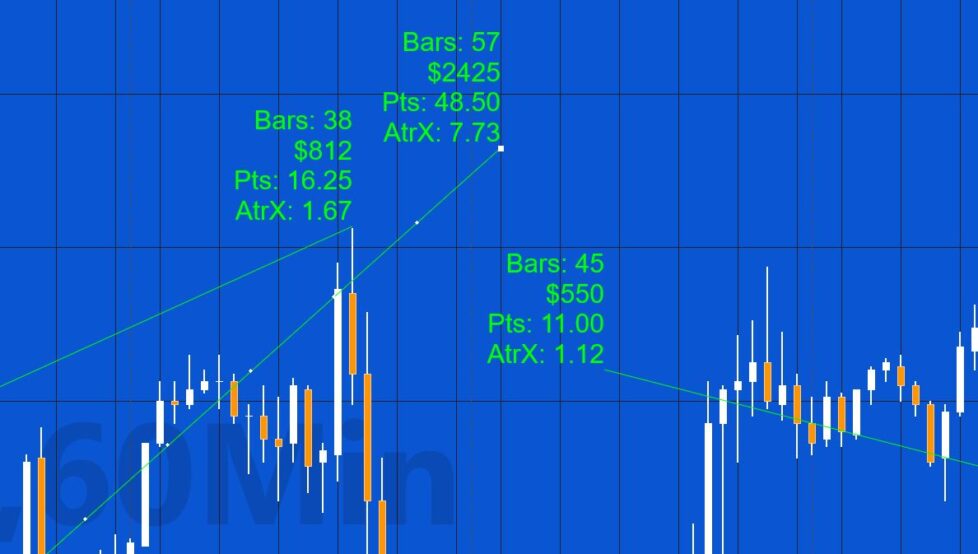
In tutorial 201 trendlines drawn on the chart are are analyzed and text is added to the chart, associated with the trendline. The contents of the text can include, either points value, dollar value, ATR move (with the ATR calculated before the trendline), number of bars or a combination of all this information depending on the setting of a user input: ShowValue.
The line can be drawn from left to right or right to left. If the line is drawn right to left the ATR value is set to zero.
If the chart is refreshed the program recalculates the values based on the trendline objects that remain on the chart. This also occurs if MaxBarsBack is set to auto-detect. In this case, when a drawing object is added earlier on the chart to the current drawing objects, the chart recalculates.
If the lines are moved or either of the start or end positions are changed, the text label is updated.
Technical lessons discussed:
– Detecting when a new drawing object is added to the chart
– Detecting an UP mouse event on a chart element
– Detecting a DOWN mouse event occurs on a trendline
– Storing all the user drawn trendlines into a vector
– Storing a text label associated with a trendline in the tag property
– Deleting an associated text label when a trendline is deleted
Original code written by Charles Atmore with some modifications by Markplex Corporation.
Explanation of tutorial 201
TO THE BEST OF MARKPLEX CORPORATION’S KNOWLEDGE, ALL OF THE INFORMATION ON THIS PAGE IS CORRECT, AND IT IS PROVIDED IN THE HOPE THAT IT WILL BE USEFUL. HOWEVER, MARKPLEX CORPORATION ASSUMES NO LIABILITY FOR ANY DAMAGES, DIRECT OR OTHERWISE, RESULTING FROM THE USE OF THIS INFORMATION AND/OR PROGRAM(S) DESCRIBED, AND NO WARRANTY IS MADE REGARDING ITS ACCURACY OR COMPLETENESS. USE OF THIS INFORMATION AND/OR PROGRAMS DESCRIBED IS AT YOUR OWN RISK.
ANY EASYLANGUAGE OR POWERLANGUAGE TRADING STRATEGIES, SIGNALS, STUDIES, INDICATORS, SHOWME STUDIES, PAINTBAR STUDIES, PROBABILITYMAP STUDIES, ACTIVITYBAR STUDIES, FUNCTIONS (AND PARTS THEREOF) AND ASSOCIATED TECHNIQUES REFERRED TO, INCLUDED IN OR ATTACHED TO THIS TUTORIAL OR PROGRAM DESCRIPTION ARE EXAMPLES ONLY, AND HAVE BEEN INCLUDED SOLELY FOR EDUCATIONAL PURPOSES. MARKPLEX CORPORATION. DOES NOT RECOMMEND THAT YOU USE ANY SUCH TRADING STRATEGIES, SIGNALS, STUDIES, INDICATORS, SHOWME STUDIES, PAINTBAR STUDIES, PROBABILITYMAP STUDIES, ACTIVITYBAR STUDIES, FUNCTIONS (OR ANY PARTS THEREOF) OR TECHNIQUES. THE USE OF ANY SUCH TRADING STRATEGIES, SIGNALS, STUDIES, INDICATORS, SHOWME STUDIES, PAINTBAR STUDIES, PROBABILITYMAP STUDIES, ACTIVITYBAR STUDIES, FUNCTIONS AND TECHNIQUES DOES NOT GUARANTEE THAT YOU WILL MAKE PROFITS, INCREASE PROFITS, OR MINIMIZE LOSSES.

