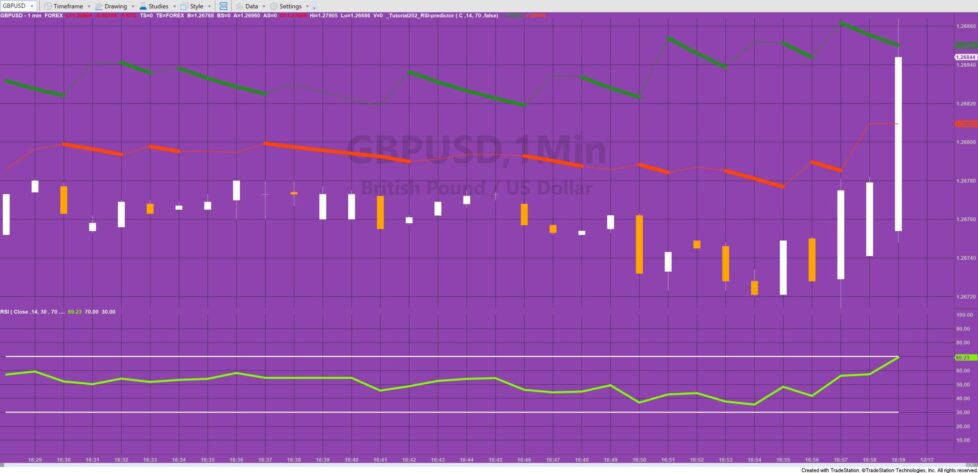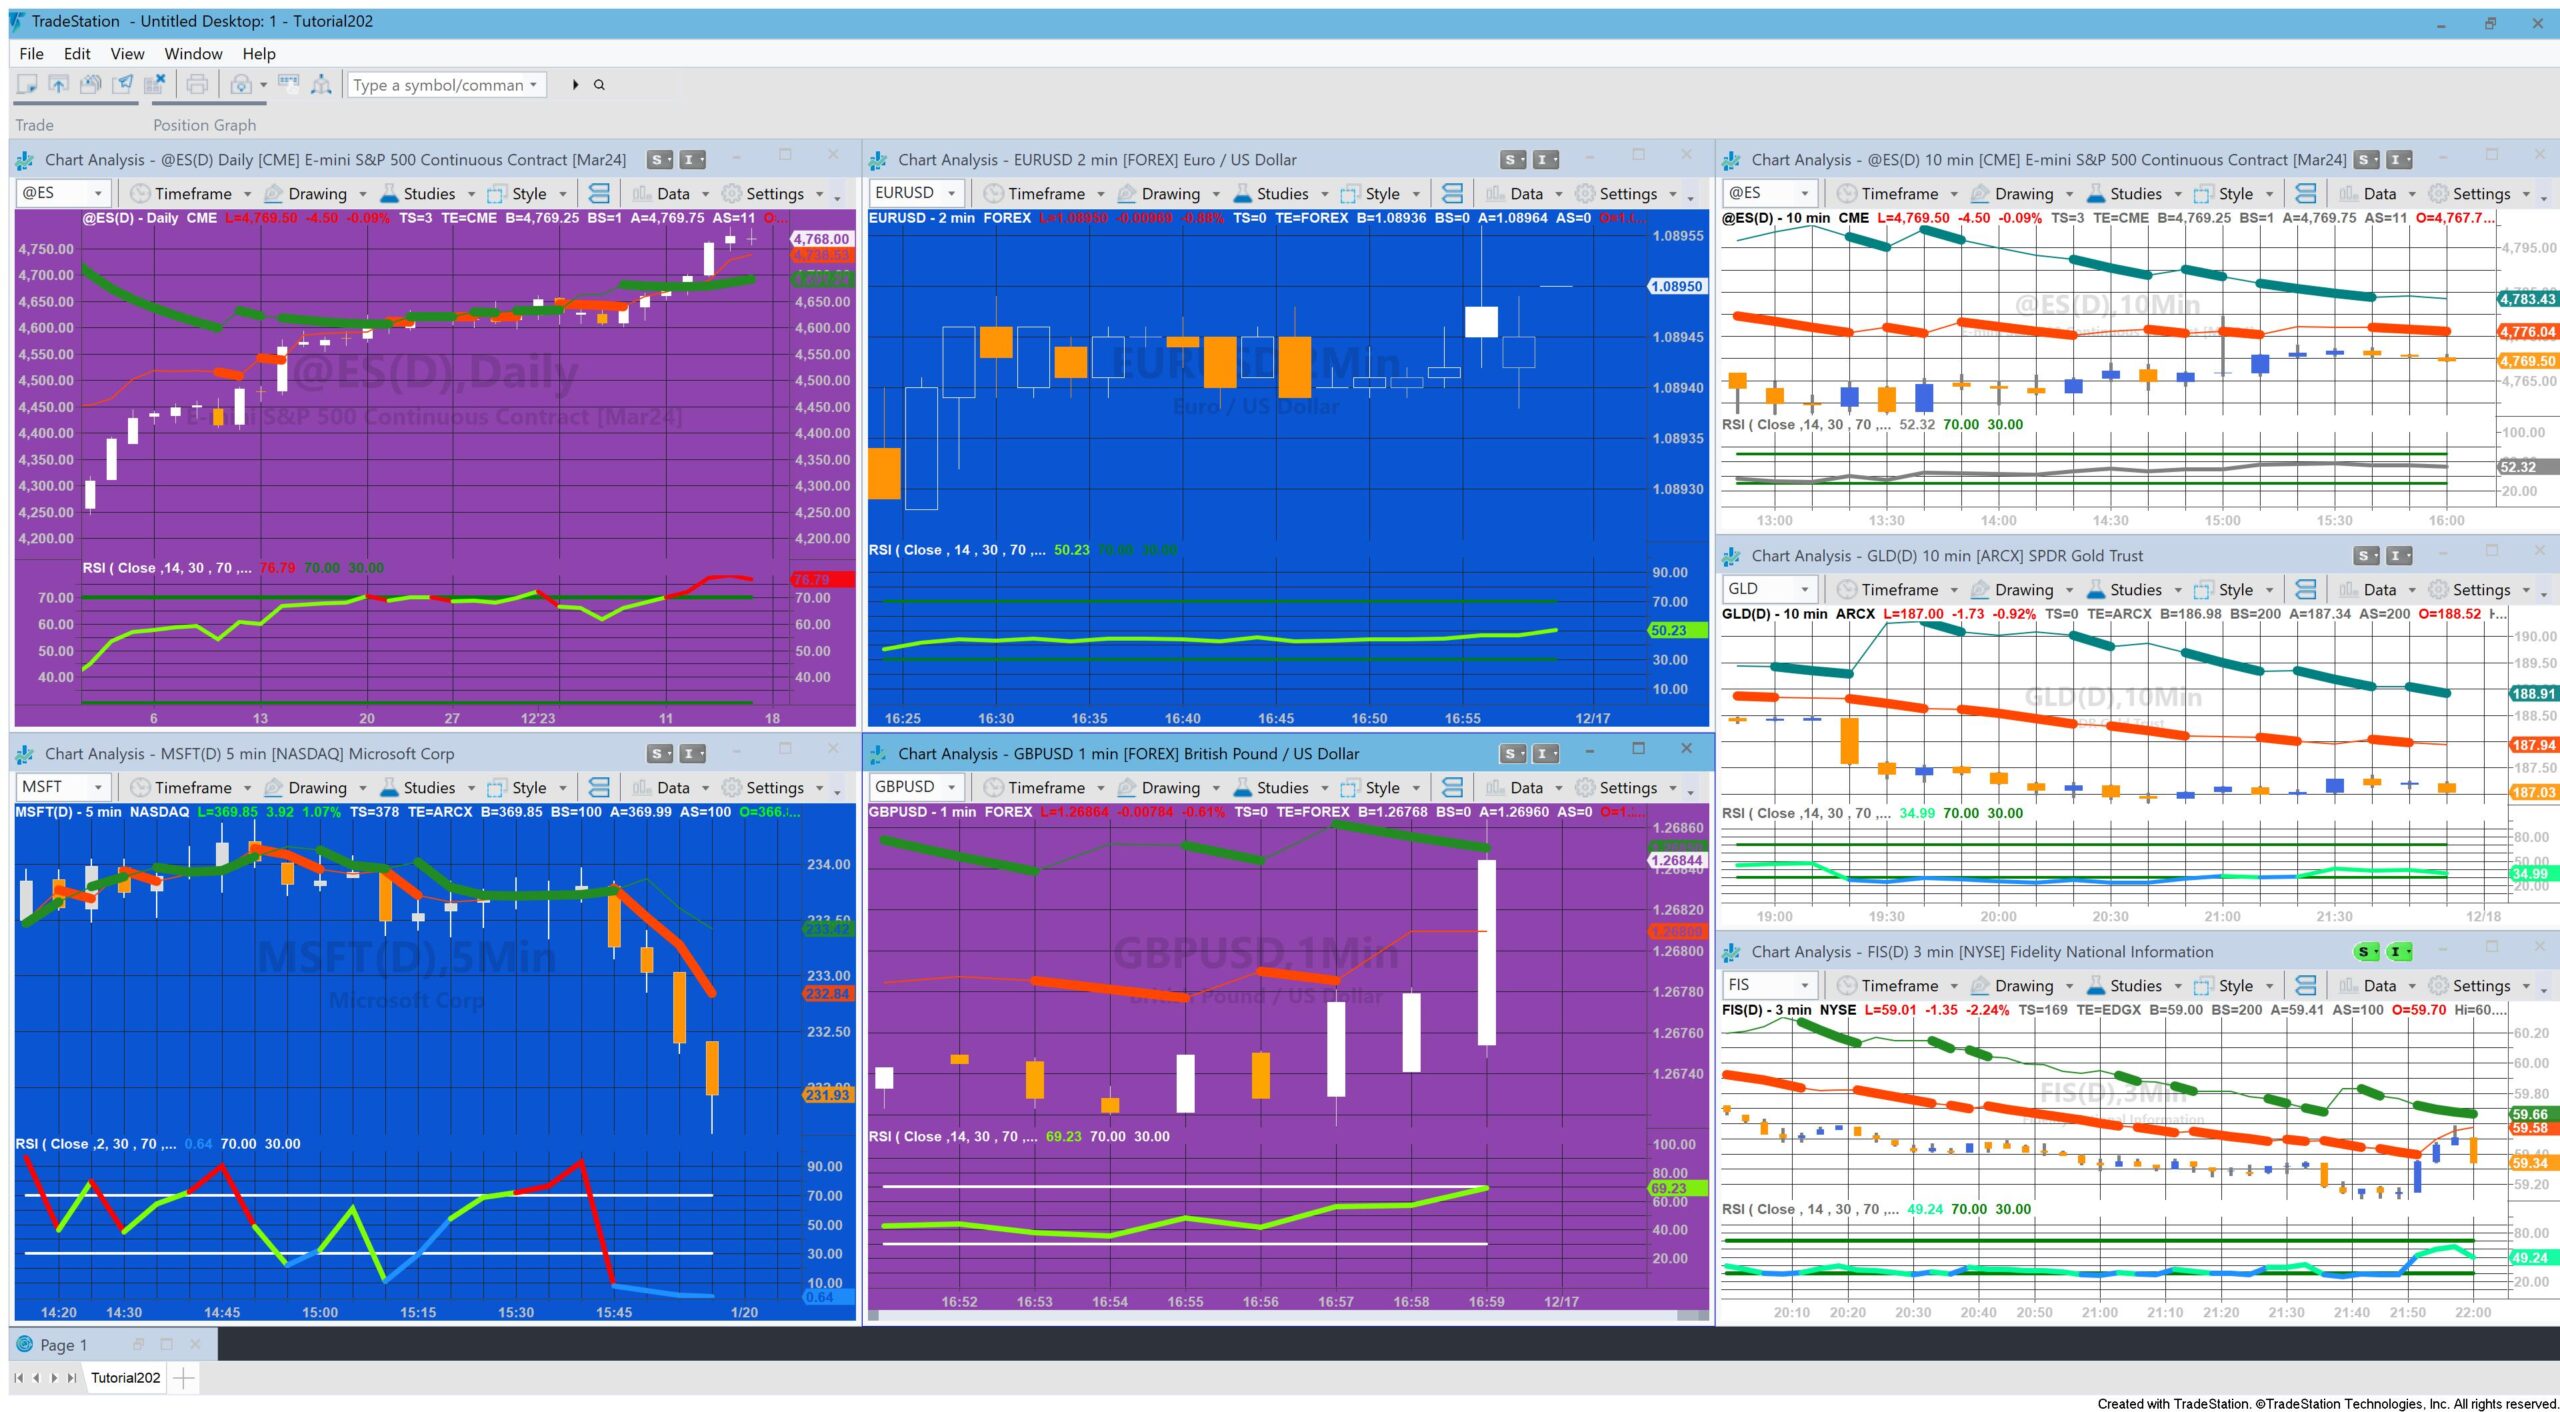
Tutorial 202 seeks to look at the RSI calculation and calculate what price (this bar) needs to be for the RSI to reach (or go down to) a specific value.
To achieve this the calculations:
RSIVal = 50 * ( ChgRatio + 1 )
where ChgRatio = NetChgAv[1] + Smooth * ( Price – Price[1] – NetChgAv[1] ) divided by TotChgAv = TotChgAv[1] + Smooth * ( AbsValue( Price – Price[1] ) – TotChgAv[1] )
are solved for Price (i.e. price this bar). Because the above formulae includes AbsValue( Price – Price[1] ) we actually need to solve for both Price – Price[1] and Price[1] – Price.
There is then an option to plot the appropriate value (i.e. if Price > Price[1] the Value calculated using Price – Price[1], otherwise the value calculated using Price[1] – Price) with a thicker line (PlotBoth set to TRUE) otherwise both lines are plotted the same thickness (PlotBoth set to FALSE).
This program’s inputs are Price, Len (the length of the RSI), TgtRSI (the RSI value that the program is targeting, and PlotBoth (see above).
To verify the program, it is useful to have the standard TradeStation RSI indicator applied to a subgraph as can be seen in the images on this page. This is not built into the tutorial 202 program.

Explanation of tutorial 202
Download of the tutorial 202
TO THE BEST OF MARKPLEX CORPORATION’S KNOWLEDGE, ALL OF THE INFORMATION ON THIS PAGE IS CORRECT, AND IT IS PROVIDED IN THE HOPE THAT IT WILL BE USEFUL. HOWEVER, MARKPLEX CORPORATION ASSUMES NO LIABILITY FOR ANY DAMAGES, DIRECT OR OTHERWISE, RESULTING FROM THE USE OF THIS INFORMATION AND/OR PROGRAM(S) DESCRIBED, AND NO WARRANTY IS MADE REGARDING ITS ACCURACY OR COMPLETENESS. USE OF THIS INFORMATION AND/OR PROGRAMS DESCRIBED IS AT YOUR OWN RISK.
ANY EASYLANGUAGE OR POWERLANGUAGE TRADING STRATEGIES, SIGNALS, STUDIES, INDICATORS, SHOWME STUDIES, PAINTBAR STUDIES, PROBABILITYMAP STUDIES, ACTIVITYBAR STUDIES, FUNCTIONS (AND PARTS THEREOF) AND ASSOCIATED TECHNIQUES REFERRED TO, INCLUDED IN OR ATTACHED TO THIS TUTORIAL OR PROGRAM DESCRIPTION ARE EXAMPLES ONLY, AND HAVE BEEN INCLUDED SOLELY FOR EDUCATIONAL PURPOSES. MARKPLEX CORPORATION. DOES NOT RECOMMEND THAT YOU USE ANY SUCH TRADING STRATEGIES, SIGNALS, STUDIES, INDICATORS, SHOWME STUDIES, PAINTBAR STUDIES, PROBABILITYMAP STUDIES, ACTIVITYBAR STUDIES, FUNCTIONS (OR ANY PARTS THEREOF) OR TECHNIQUES. THE USE OF ANY SUCH TRADING STRATEGIES, SIGNALS, STUDIES, INDICATORS, SHOWME STUDIES, PAINTBAR STUDIES, PROBABILITYMAP STUDIES, ACTIVITYBAR STUDIES, FUNCTIONS AND TECHNIQUES DOES NOT GUARANTEE THAT YOU WILL MAKE PROFITS, INCREASE PROFITS, OR MINIMIZE LOSSES.

