A Gold Pass member asked how it would be possible to display the Volume Ratio on RadarScreen. As you may know the standard indicator (Volume Ratio) is not available for RadarScreen because it uses the following code:
TotalTicks = UpTicks + DownTicks;
If TotalTicks > 0 then VolRatio = 100 * ( UpTicks - DownTicks ) / TotalTicks
else VolRatio = 0;
VolRatioAvg = XAverage( VolRatio, AvgLength );
and UpTicks and DownTicks return zero in RadarScreen.
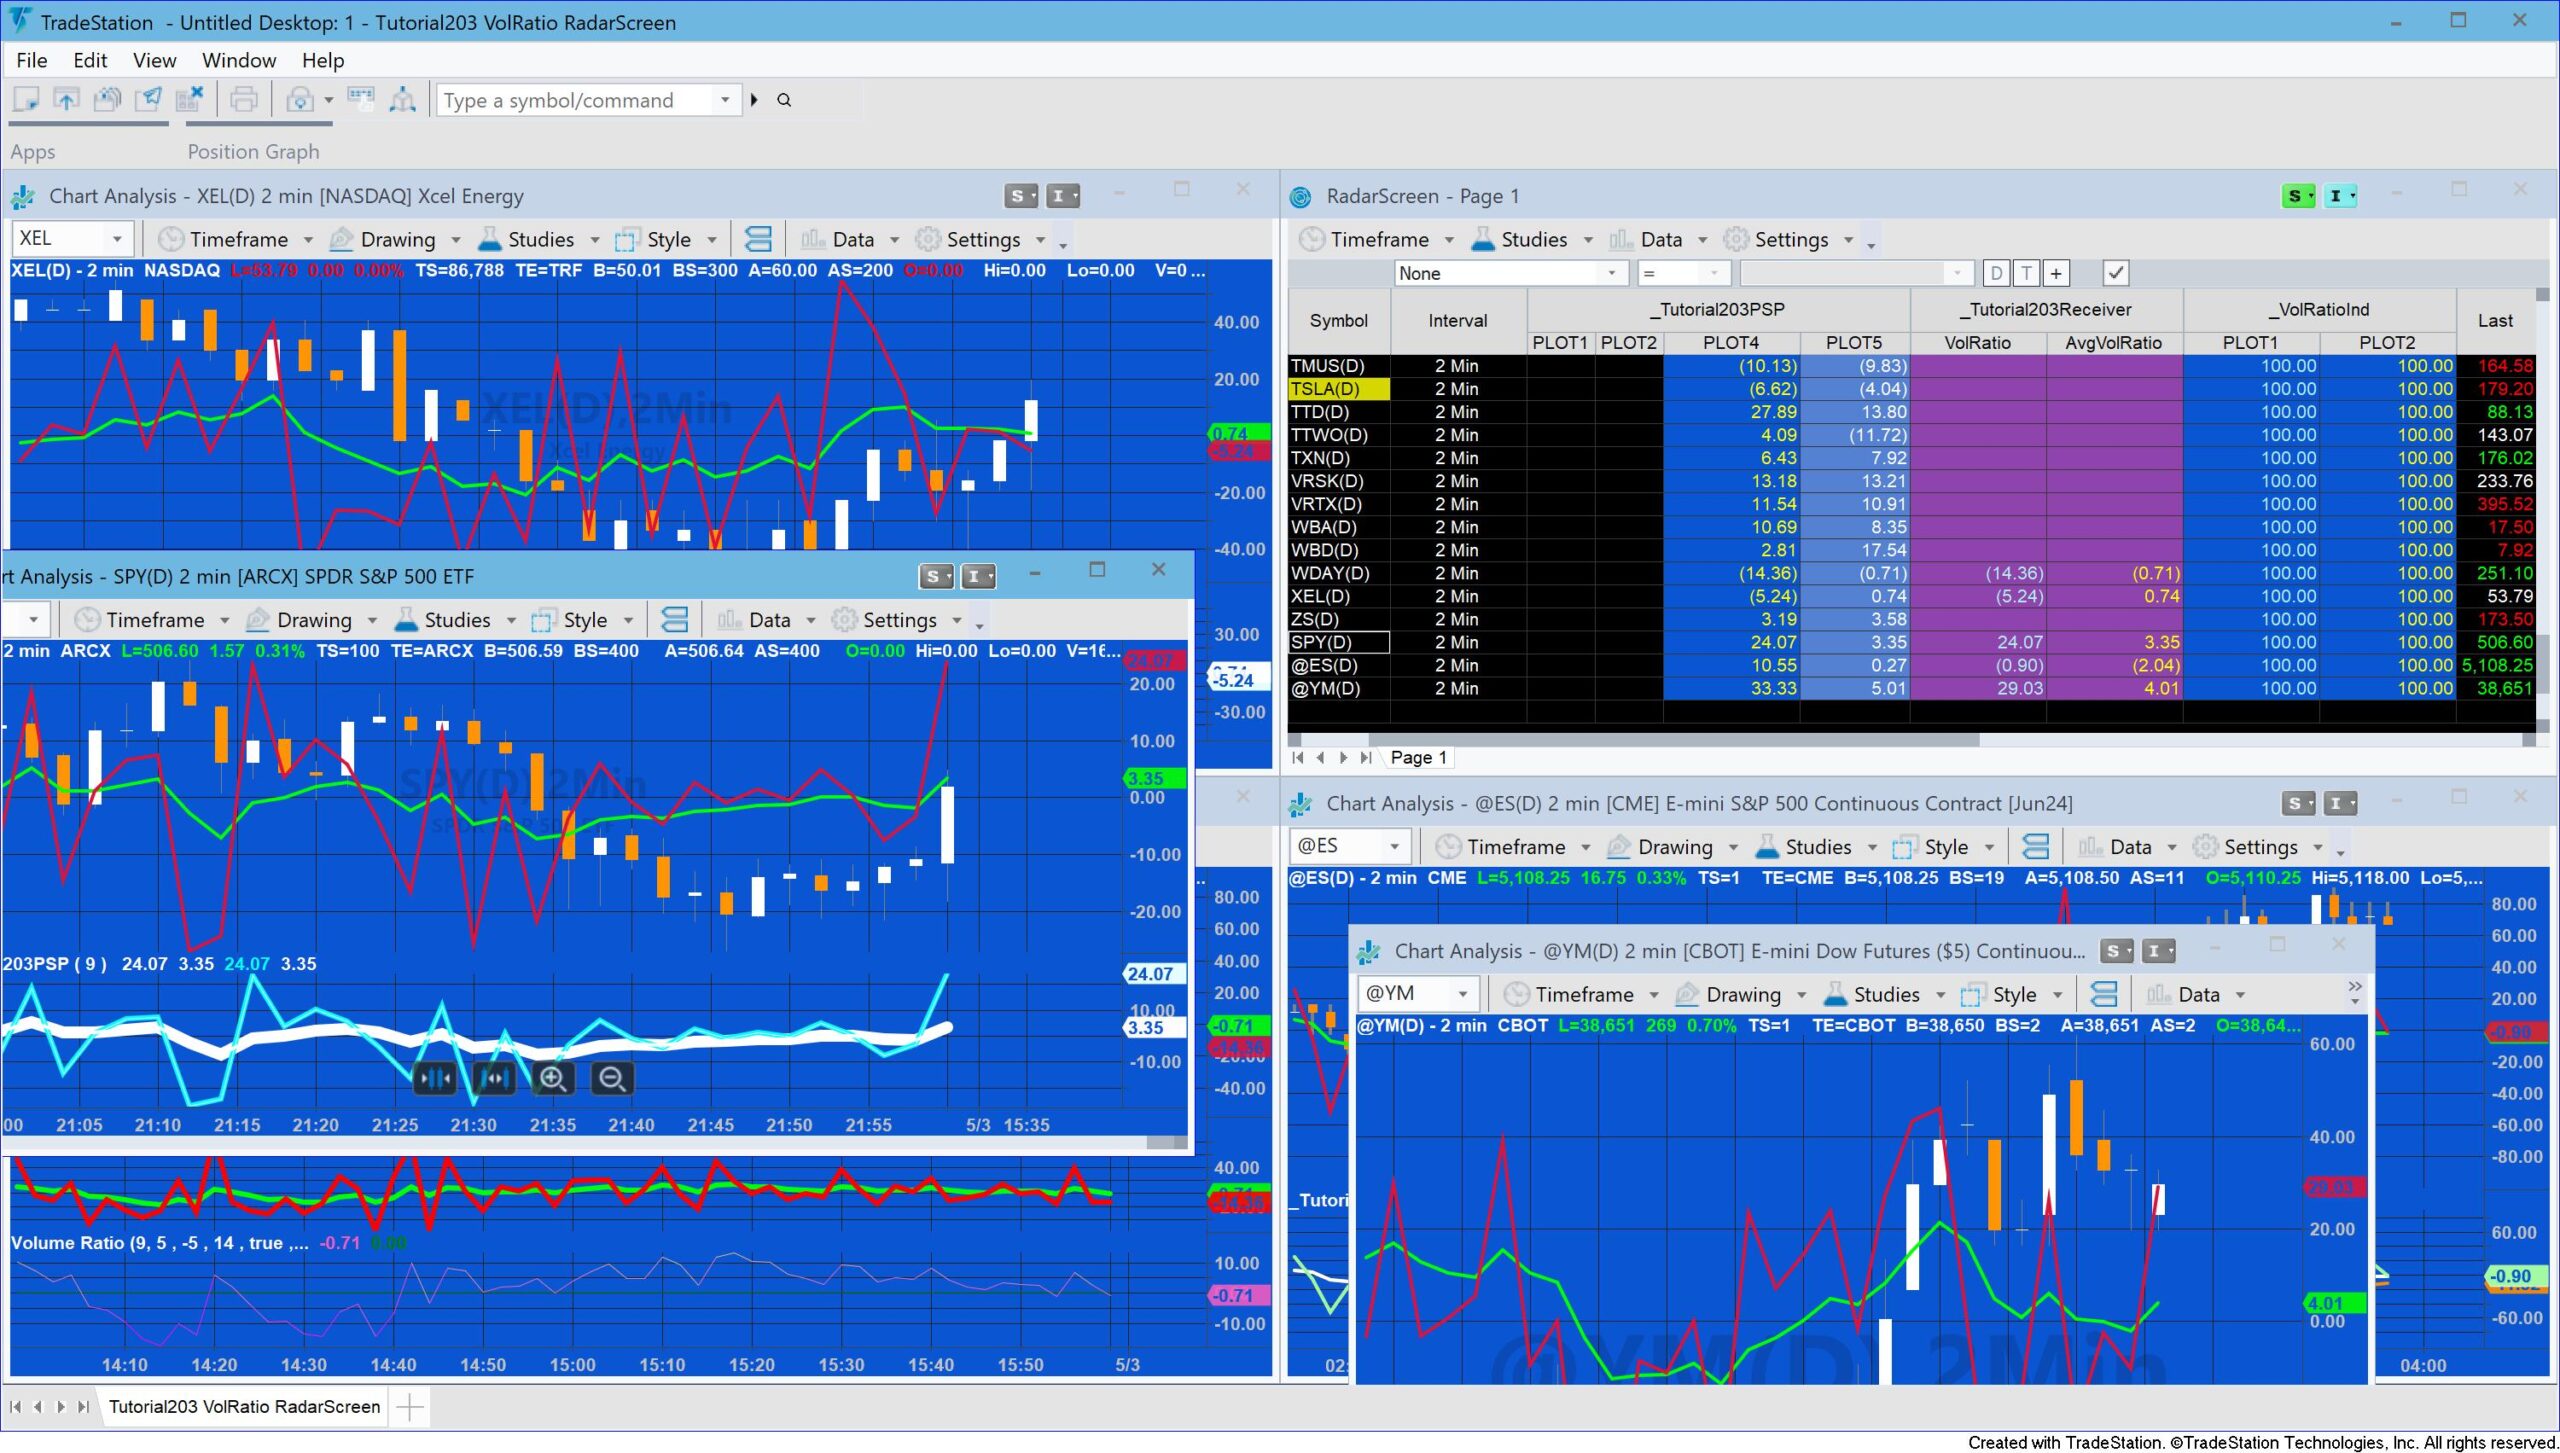
Tutorial 203 demonstrates a couple of ways that volume ratio can be displayed in RadarScreen.
The first way uses a program applied to a chart which calculates the Volume Ratio and then uses the Global Dictionary to share the data with a receiving program applied to RadarScreen.
The second way uses a Price Series Provider to calculate Volume Ratio within RadarScreen.

_Tutorial203Sender/_Tutorial203Receiver
The programs are explained in the video following.
_Tutorial203Sender works by creating a global dictionary (VolRatioGDict) and a vector (RatioVector). The VolRatio is calculated using the normal algorithm and the exponential average of the VolRatio is calculated using the standard XAverage function. Both values are then added to the RatioVector vector which is in turn added to the GlobalDictionary using the name of the symbol as the key. The calculated values are also plotted.
In _Tutorial203Receiver a Global Dictionary is created (VolRatioGDict) and a vector (ReceivedRatioVect). Item added and item changed events are also set up for VolRatioGDict. When either of these events is triggered a method (UpdatePlot) is called. This method checks to see if there are any elements in the global dictionary with a key of the current sysmbol. If so, the value stored for the key is stored in the ReceivedRatioVect vector. The values in the vector (i.e. VolRatio and the exponential average of volratio) are plotted.

_Tutorial203PSP
_Tutorial203PSP is designed to display the volume ratio on RadarScreen. The standard indicator cannot be used on RadarScreen because it uses UpTicks and Downticks, both of which return zero. Instead it uses a Price Series Provider with the same interval as the RadarScreen row.
The program includes two different ways to calculate the exponential moving average.
The program can also be used on charts but due to RadArscreen and chart data not being tightly synchronized there are occasional bad calculations. This is explained in the video at the tutorial page.
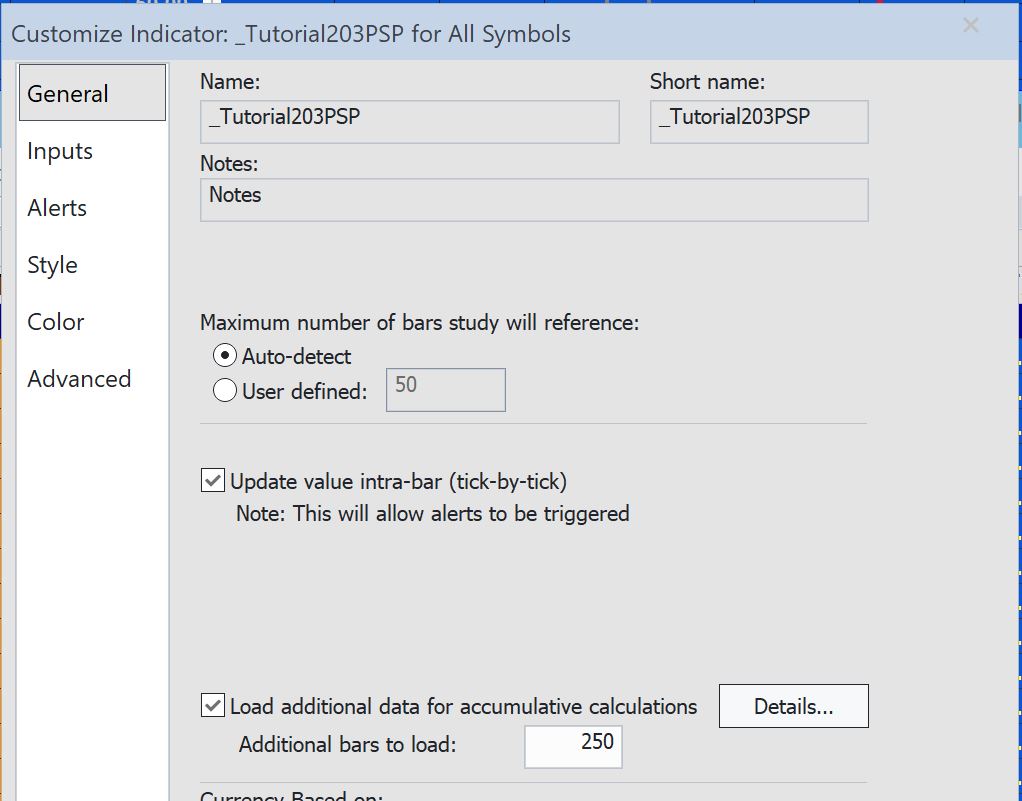
Make sure that ‘Load additional data for accumulative calculations’ is checked. Start with a value of 100 and add more if the calculated value does not match the value calculated on a chart for the same interval using the standard TradeStation VolRatio indicator.
_Tutorial203PSP This program assumes that a minute interval is being used.
Explanation of tutorial 203

Download the tutorial 203 programs
If you wish to save yourself some typing, the tutorial programs are available for immediate download by clicking the ‘add to cart’ button below. You may pay using PayPal or a credit card. The price is $29.95
TO THE BEST OF MARKPLEX CORPORATION’S KNOWLEDGE, ALL OF THE INFORMATION ON THIS PAGE IS CORRECT, AND IT IS PROVIDED IN THE HOPE THAT IT WILL BE USEFUL. HOWEVER, MARKPLEX CORPORATION ASSUMES NO LIABILITY FOR ANY DAMAGES, DIRECT OR OTHERWISE, RESULTING FROM THE USE OF THIS INFORMATION AND/OR PROGRAM(S) DESCRIBED, AND NO WARRANTY IS MADE REGARDING ITS ACCURACY OR COMPLETENESS. USE OF THIS INFORMATION AND/OR PROGRAMS DESCRIBED IS AT YOUR OWN RISK.
ANY EASYLANGUAGE OR POWERLANGUAGE TRADING STRATEGIES, SIGNALS, STUDIES, INDICATORS, SHOWME STUDIES, PAINTBAR STUDIES, PROBABILITYMAP STUDIES, ACTIVITYBAR STUDIES, FUNCTIONS (AND PARTS THEREOF) AND ASSOCIATED TECHNIQUES REFERRED TO, INCLUDED IN OR ATTACHED TO THIS TUTORIAL OR PROGRAM DESCRIPTION ARE EXAMPLES ONLY, AND HAVE BEEN INCLUDED SOLELY FOR EDUCATIONAL PURPOSES. MARKPLEX CORPORATION. DOES NOT RECOMMEND THAT YOU USE ANY SUCH TRADING STRATEGIES, SIGNALS, STUDIES, INDICATORS, SHOWME STUDIES, PAINTBAR STUDIES, PROBABILITYMAP STUDIES, ACTIVITYBAR STUDIES, FUNCTIONS (OR ANY PARTS THEREOF) OR TECHNIQUES. THE USE OF ANY SUCH TRADING STRATEGIES, SIGNALS, STUDIES, INDICATORS, SHOWME STUDIES, PAINTBAR STUDIES, PROBABILITYMAP STUDIES, ACTIVITYBAR STUDIES, FUNCTIONS AND TECHNIQUES DOES NOT GUARANTEE THAT YOU WILL MAKE PROFITS, INCREASE PROFITS, OR MINIMIZE LOSSES.

