

A Gold Pass asked for a tutorial about how to write a program for a situation where, in order to generate a trade or a show-me dot, three conditions needed to occur, not necessarily simultaneously.
In this scenario the first condition should occur, then the second condition, within a specified number of bars of the first. Finally a third condition would occur within a certain number of bars of the second.
In the example demonstrated in the tutorial the program looks for the moving average cross over. When it found it then looks for a Doji for the next 5 bars. If the Doji is found the program then looks for a Bullish Harami with the next 24 bars. The show me plots every time one of the conditions is found, a green dot for the average cross-over, a blue dot for a Doji and a red dot for a Bullish Harami.
In the strategy version a market order is made when the three conditions have occurred.
In the strategy version a market order is made when the three conditions have occurred.
The way the program works is by using counters that continually increment. When one of the conditions occurs, the counter for that condition is reset to zero.
Note that the initial values for the counters are set to a level where a condition is erroneously recorded.
It is useful to create a show me study prior to a strategy to ensure that the program is working as anticipated.

The initial values of the counter variables are set to avoid ‘false positives.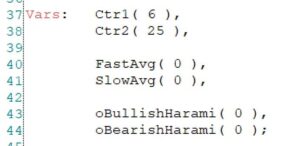 ‘
‘
Explanation of tutorial 204
Tutorial 204 programs
If you wish to save yourself some typing, the tutorial programs are available to be copied into EasyLanguage.
MARKPLEX CORPORATION ASSUMES NO LIABILITY FOR ANY DAMAGES, DIRECT OR OTHERWISE, RESULTING FROM THE USE OF THIS INFORMATION, AND NO WARRANTY IS MADE REGARDING ITS ACCURACY OR COMPLETENESS. USE OF THIS INFORMATION IS AT YOUR OWN RISK.
_Tutorial204
{ THIS SHOWME STUDY IS PROVIDED IN THE HOPE THAT IT WILL BE USEFUL. HOWEVER, MARKPLEX CORPORATION ASSUMES NO LIABILITY
FOR ANY DAMAGES, DIRECT OR OTHERWISE, RESULTING FROM THE USE OF THIS INFORMATION, AND NO WARRANTY IS MADE REGARDING ITS
ACCURACY OR COMPLETENESS. USE OF THIS INFORMATION IS AT YOUR OWN RISK. THIS SHOWME STUDY AND ASSOCIATED TECHNIQUES IS
AN EXAMPLE ONLY, AND HAS BEEN INCLUDED SOLELY FOR EDUCATIONAL PURPOSES. MARKPLEX CORPORATION DOES NOT RECOMMEND THAT
YOU USE ANY SUCH TRADING STRATEGIES, INDICATORS, SHOWME STUDIES, PAINTBAR STUDIES, PROBABILITYMAP STUDIES, ACTIVITYBAR
STUDIES, FUNCTIONS (OR ANY PARTS THEREOF) OR TECHNIQUES. THE USE OF THIS SHOWME STUDY DOES NOT GUARANTEE THAT YOU WILL
MAKE PROFITS, INCREASE PROFITS, OR MINIMIZE LOSSES.}

{ A Gold Pass asked for a tutorial about how to write a program that looked for three conditions to occur, in order.
The first condition should occur, then the second condiaion should occur within a specified number of bars of the
first. Finally a thried condition would occur within a certain number of bars of the second.

The occurances being looked for in this show me study are a moving average cross over, a doji and and Bullish
Harami. There was no particular logic in picking these specific conditions merely just a way of demonstrating this
technique. In this example the program looks for the moving average cross over. When it found it then looks for a
Doji for the next 5 bars. If the Doji is found the program then looks for a Bullish Harami with the next 24 bars. The
show me plots every time one of the conditions is found, a green dot for the average cross-over, a blue dot
for a Doji and a red dot for a Bullish Harami.

The way the program works is by using counters that continually increment. When one of the conditions occurs, the
counter for that condition is reset to zero.

Note that the initial values for the counters are set to a level where a condition is erroneously recorded.

It is useful to create a show me study prior to a strategy to ensure that the program is working as anticipated.

See also _Tutorial204Strat }


Input:	FastLen( 9 ), // Value for fast moving average
		SlowLen( 14 ), // Value for slow moving average

		DojiPercentage( 10 ), // Percentage dfeining how small the DOJI body cab be
		BHLength( 5 ); // Leangth to calculate bar average for Bullish Harami


Vars:	Ctr1( 6 ),
		Ctr2( 25 ),

		FastAvg( 0 ),
		SlowAvg( 0 ),

		oBullishHarami( 0 ),
		oBearishHarami( 0 );

// Look for an average cross over
FastAvg = AverageFC( C, FastLen );
SlowAvg = AverageFC( C, SlowLen );
If FastAvg Crosses over SlowAvg then
Begin
	Ctr1 = 0;
	Plot1( H, "AvX", Green );
End;

// Determine if Doji has occurred, if so set Doji to TRUE
If Ctr1 <= 5 and C_Doji( DojiPercentage ) = 1 then
Begin
	Ctr2 = 0;
	Plot2( C, "Doji", Cyan );
End;

// Look for Bullish Harami while Ctr2 is less than 25
Value1 = C_BullHar_BearHar( BHLength, oBullishHarami, oBearishHarami );
If Ctr2 < 25 and oBullishHarami = 1 Then Plot3( L, "BH", Red );

// Print counters
Print( D, T, " ", Ctr1, " ", Ctr2 );

// Increment the counters
Ctr1 += 1;
Ctr2 += 1;

{ ** Copyright (c) 2024 Markplex Corporation. All rights reserved. **
  ** Markplex Corporation reserves the right to modify or overwrite this analysis technique
     on its https://markplex.com Web site. ** }
_Tutorial204Strat
{ THIS SHOWME STUDY IS PROVIDED IN THE HOPE THAT IT WILL BE USEFUL. HOWEVER, MARKPLEX CORPORATION ASSUMES NO LIABILITY
FOR ANY DAMAGES, DIRECT OR OTHERWISE, RESULTING FROM THE USE OF THIS INFORMATION, AND NO WARRANTY IS MADE REGARDING ITS
ACCURACY OR COMPLETENESS. USE OF THIS INFORMATION IS AT YOUR OWN RISK. THIS SHOWME STUDY AND ASSOCIATED TECHNIQUES IS
AN EXAMPLE ONLY, AND HAS BEEN INCLUDED SOLELY FOR EDUCATIONAL PURPOSES. MARKPLEX CORPORATION DOES NOT RECOMMEND THAT
YOU USE ANY SUCH TRADING STRATEGIES, INDICATORS, SHOWME STUDIES, PAINTBAR STUDIES, PROBABILITYMAP STUDIES, ACTIVITYBAR
STUDIES, FUNCTIONS (OR ANY PARTS THEREOF) OR TECHNIQUES. THE USE OF THIS SHOWME STUDY DOES NOT GUARANTEE THAT YOU WILL
MAKE PROFITS, INCREASE PROFITS, OR MINIMIZE LOSSES.}

{ A Gold Pass asked for a tutorial about how to write a program that looked for three conditions to occur, in order.
The first condition should occur, then the second condiaion should occur within a specified number of bars of the
first. Finally a thried condition would occur within a certain number of bars of the second.

The occurances being looked for in this show me study are a moving average cross over, a doji and and Bullish
Harami. There was no particular logic in picking these specific conditions merely just a way of demonstrating this
technique. In this example the program looks for the moving average cross over. When it found it then looks for a
Doji for the next 5 bars. If the Doji is found the program then looks for a Bullish Harami with the next 24 bars. The
show me plots every time one of the conditions is found, a green dot for the average cross-over, a blue dot
for a Doji and a red dot for a Bullish Harami.

The way the program works is by using counters that continually increment. When one of the conditions occurs, the
counter for that condition is reset to zero.

Note that the initial values for the counters are set to a level where a condition is erroneously recorded.

It is useful to create a show me study prior to a strategy to ensure that the program is working as anticipated.

See also _Tutorial204Strat }


Input:	FastLen( 9 ), // Value for fast moving average
		SlowLen( 14 ), // Value for slow moving average

		DojiPercentage( 10 ), // Percentage dfeining how small the DOJI body cab be
		BHLength( 5 ); // Leangth to calculate bar average for Bullish Harami


Vars:	Ctr1( 6 ),
		Ctr2( 25 ),

		FastAvg( 0 ),
		SlowAvg( 0 ),

		oBullishHarami( 0 ),
		oBearishHarami( 0 );

// Look for an average cross over
FastAvg = AverageFC( C, FastLen );
SlowAvg = AverageFC( C, SlowLen );
If FastAvg Crosses over SlowAvg then
Begin
	Ctr1 = 0;
	Plot1( H, "AvX", Green );
End;

// Determine if Doji has occurred, if so set Doji to TRUE
If Ctr1 <= 5 and C_Doji( DojiPercentage ) = 1 then
Begin
	Ctr2 = 0;
	Plot2( C, "Doji", Cyan );
End;

// Look for Bullish Harami while Ctr2 is less than 25
Value1 = C_BullHar_BearHar( BHLength, oBullishHarami, oBearishHarami );
If Ctr2 < 25 and oBullishHarami = 1 Then Plot3( L, "BH", Red );

// Print counters
Print( D, T, " ", Ctr1, " ", Ctr2 );

// Increment the counters
Ctr1 += 1;
Ctr2 += 1;

{ ** Copyright (c) 2024 Markplex Corporation. All rights reserved. **
  ** Markplex Corporation reserves the right to modify or overwrite this analysis technique
     on its https://markplex.com Web site. ** }
TO THE BEST OF MARKPLEX CORPORATION’S KNOWLEDGE, ALL OF THE INFORMATION ON THIS PAGE IS CORRECT, AND IT IS PROVIDED IN THE HOPE THAT IT WILL BE USEFUL. HOWEVER, MARKPLEX CORPORATION ASSUMES NO LIABILITY FOR ANY DAMAGES, DIRECT OR OTHERWISE, RESULTING FROM THE USE OF THIS INFORMATION AND/OR PROGRAM(S) DESCRIBED, AND NO WARRANTY IS MADE REGARDING ITS ACCURACY OR COMPLETENESS. USE OF THIS INFORMATION AND/OR PROGRAMS DESCRIBED IS AT YOUR OWN RISK.
ANY EASYLANGUAGE OR POWERLANGUAGE TRADING STRATEGIES, SIGNALS, STUDIES, INDICATORS, SHOWME STUDIES, PAINTBAR STUDIES, PROBABILITYMAP STUDIES, ACTIVITYBAR STUDIES, FUNCTIONS (AND PARTS THEREOF) AND ASSOCIATED TECHNIQUES REFERRED TO, INCLUDED IN OR ATTACHED TO THIS TUTORIAL OR PROGRAM DESCRIPTION ARE EXAMPLES ONLY, AND HAVE BEEN INCLUDED SOLELY FOR EDUCATIONAL PURPOSES. MARKPLEX CORPORATION. DOES NOT RECOMMEND THAT YOU USE ANY SUCH TRADING STRATEGIES, SIGNALS, STUDIES, INDICATORS, SHOWME STUDIES, PAINTBAR STUDIES, PROBABILITYMAP STUDIES, ACTIVITYBAR STUDIES, FUNCTIONS (OR ANY PARTS THEREOF) OR TECHNIQUES. THE USE OF ANY SUCH TRADING STRATEGIES, SIGNALS, STUDIES, INDICATORS, SHOWME STUDIES, PAINTBAR STUDIES, PROBABILITYMAP STUDIES, ACTIVITYBAR STUDIES, FUNCTIONS AND TECHNIQUES DOES NOT GUARANTEE THAT YOU WILL MAKE PROFITS, INCREASE PROFITS, OR MINIMIZE LOSSES.