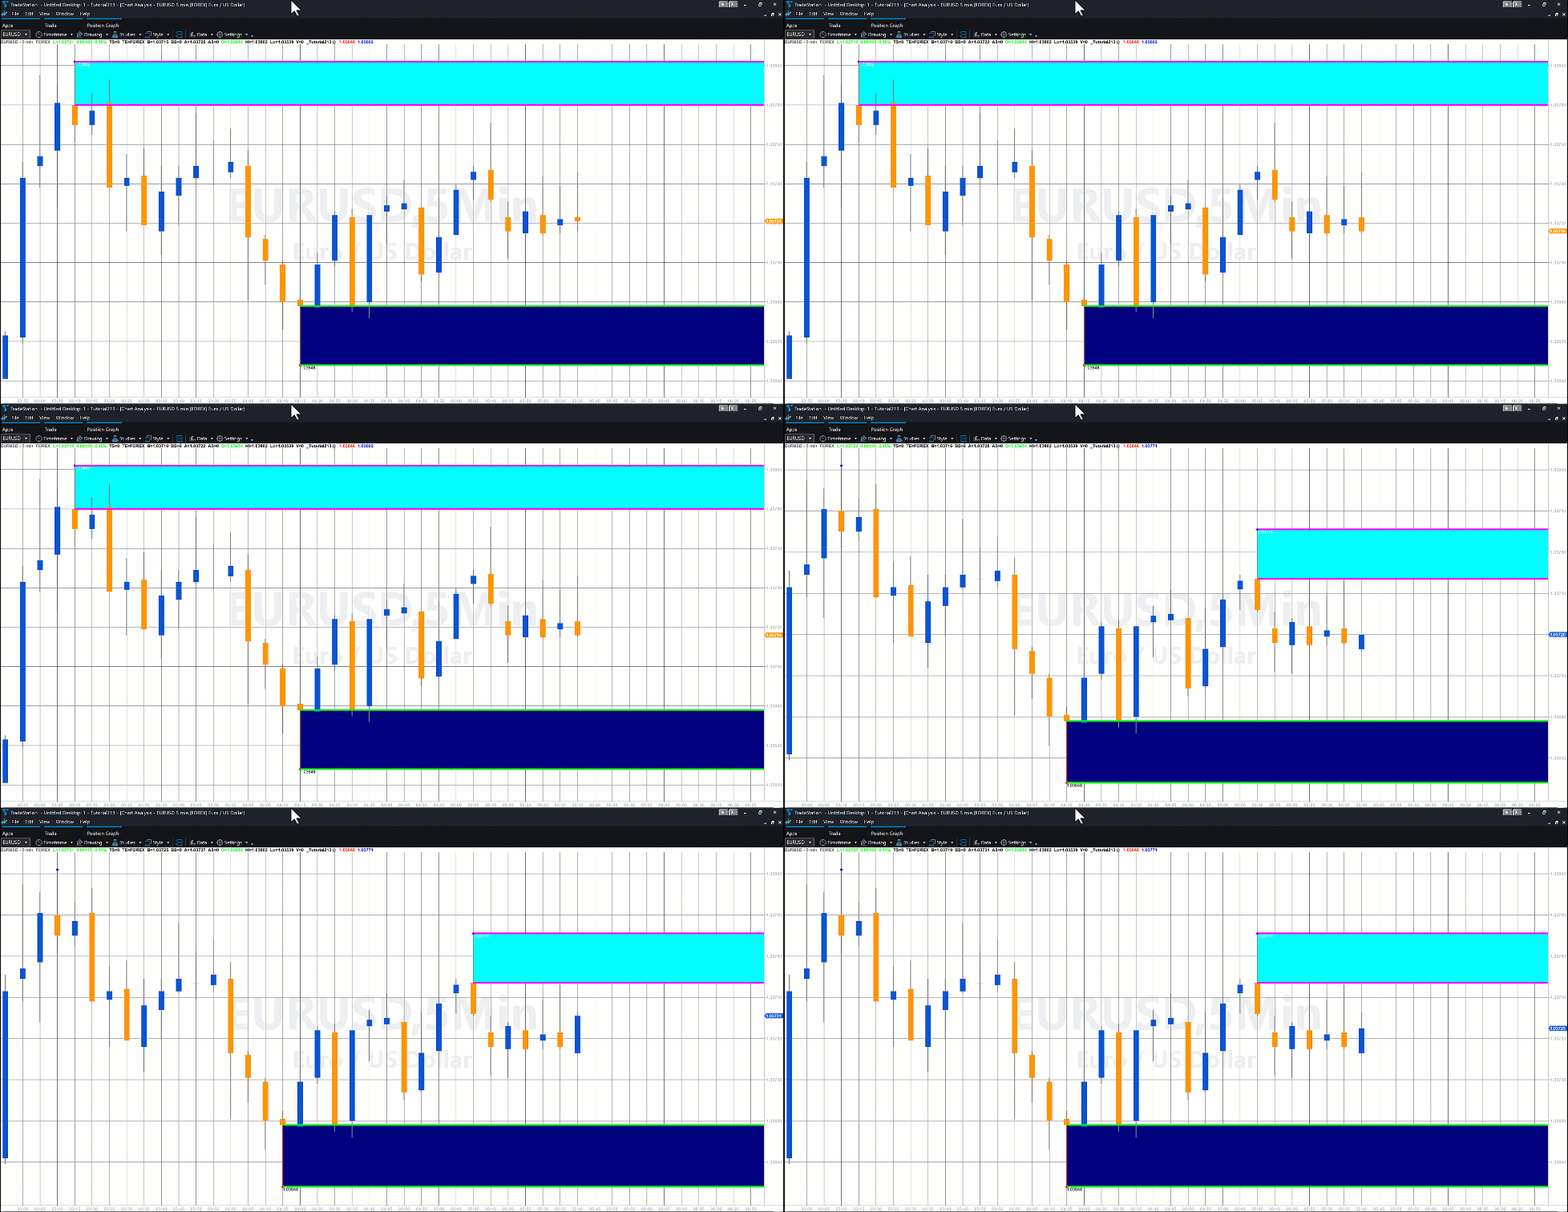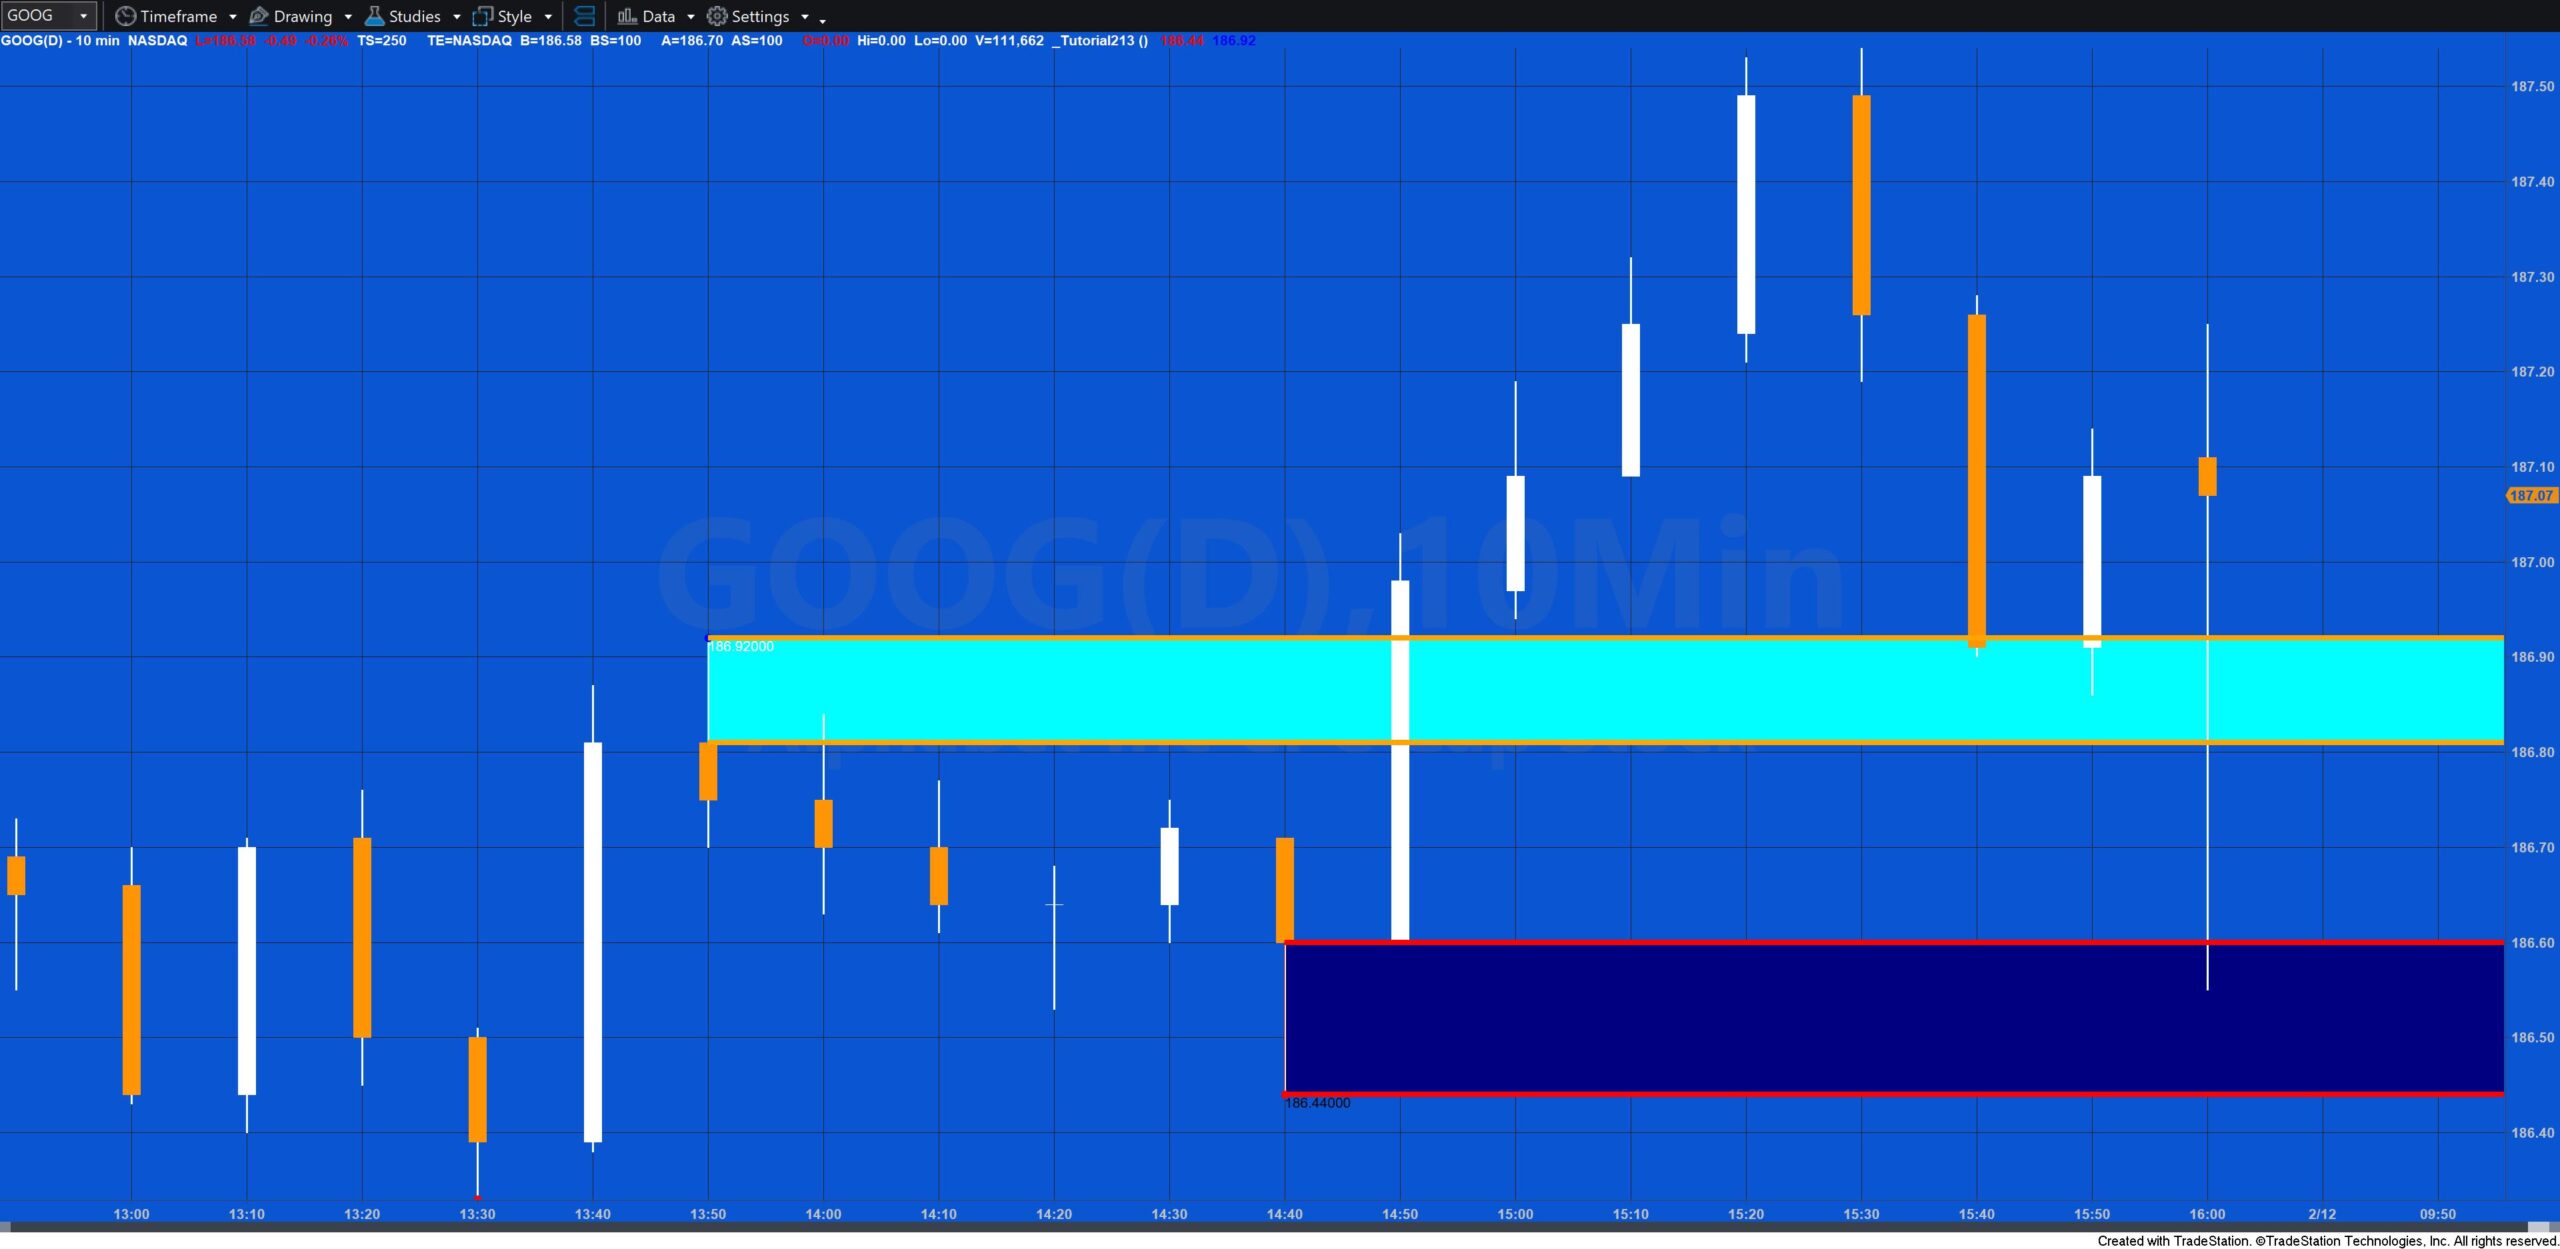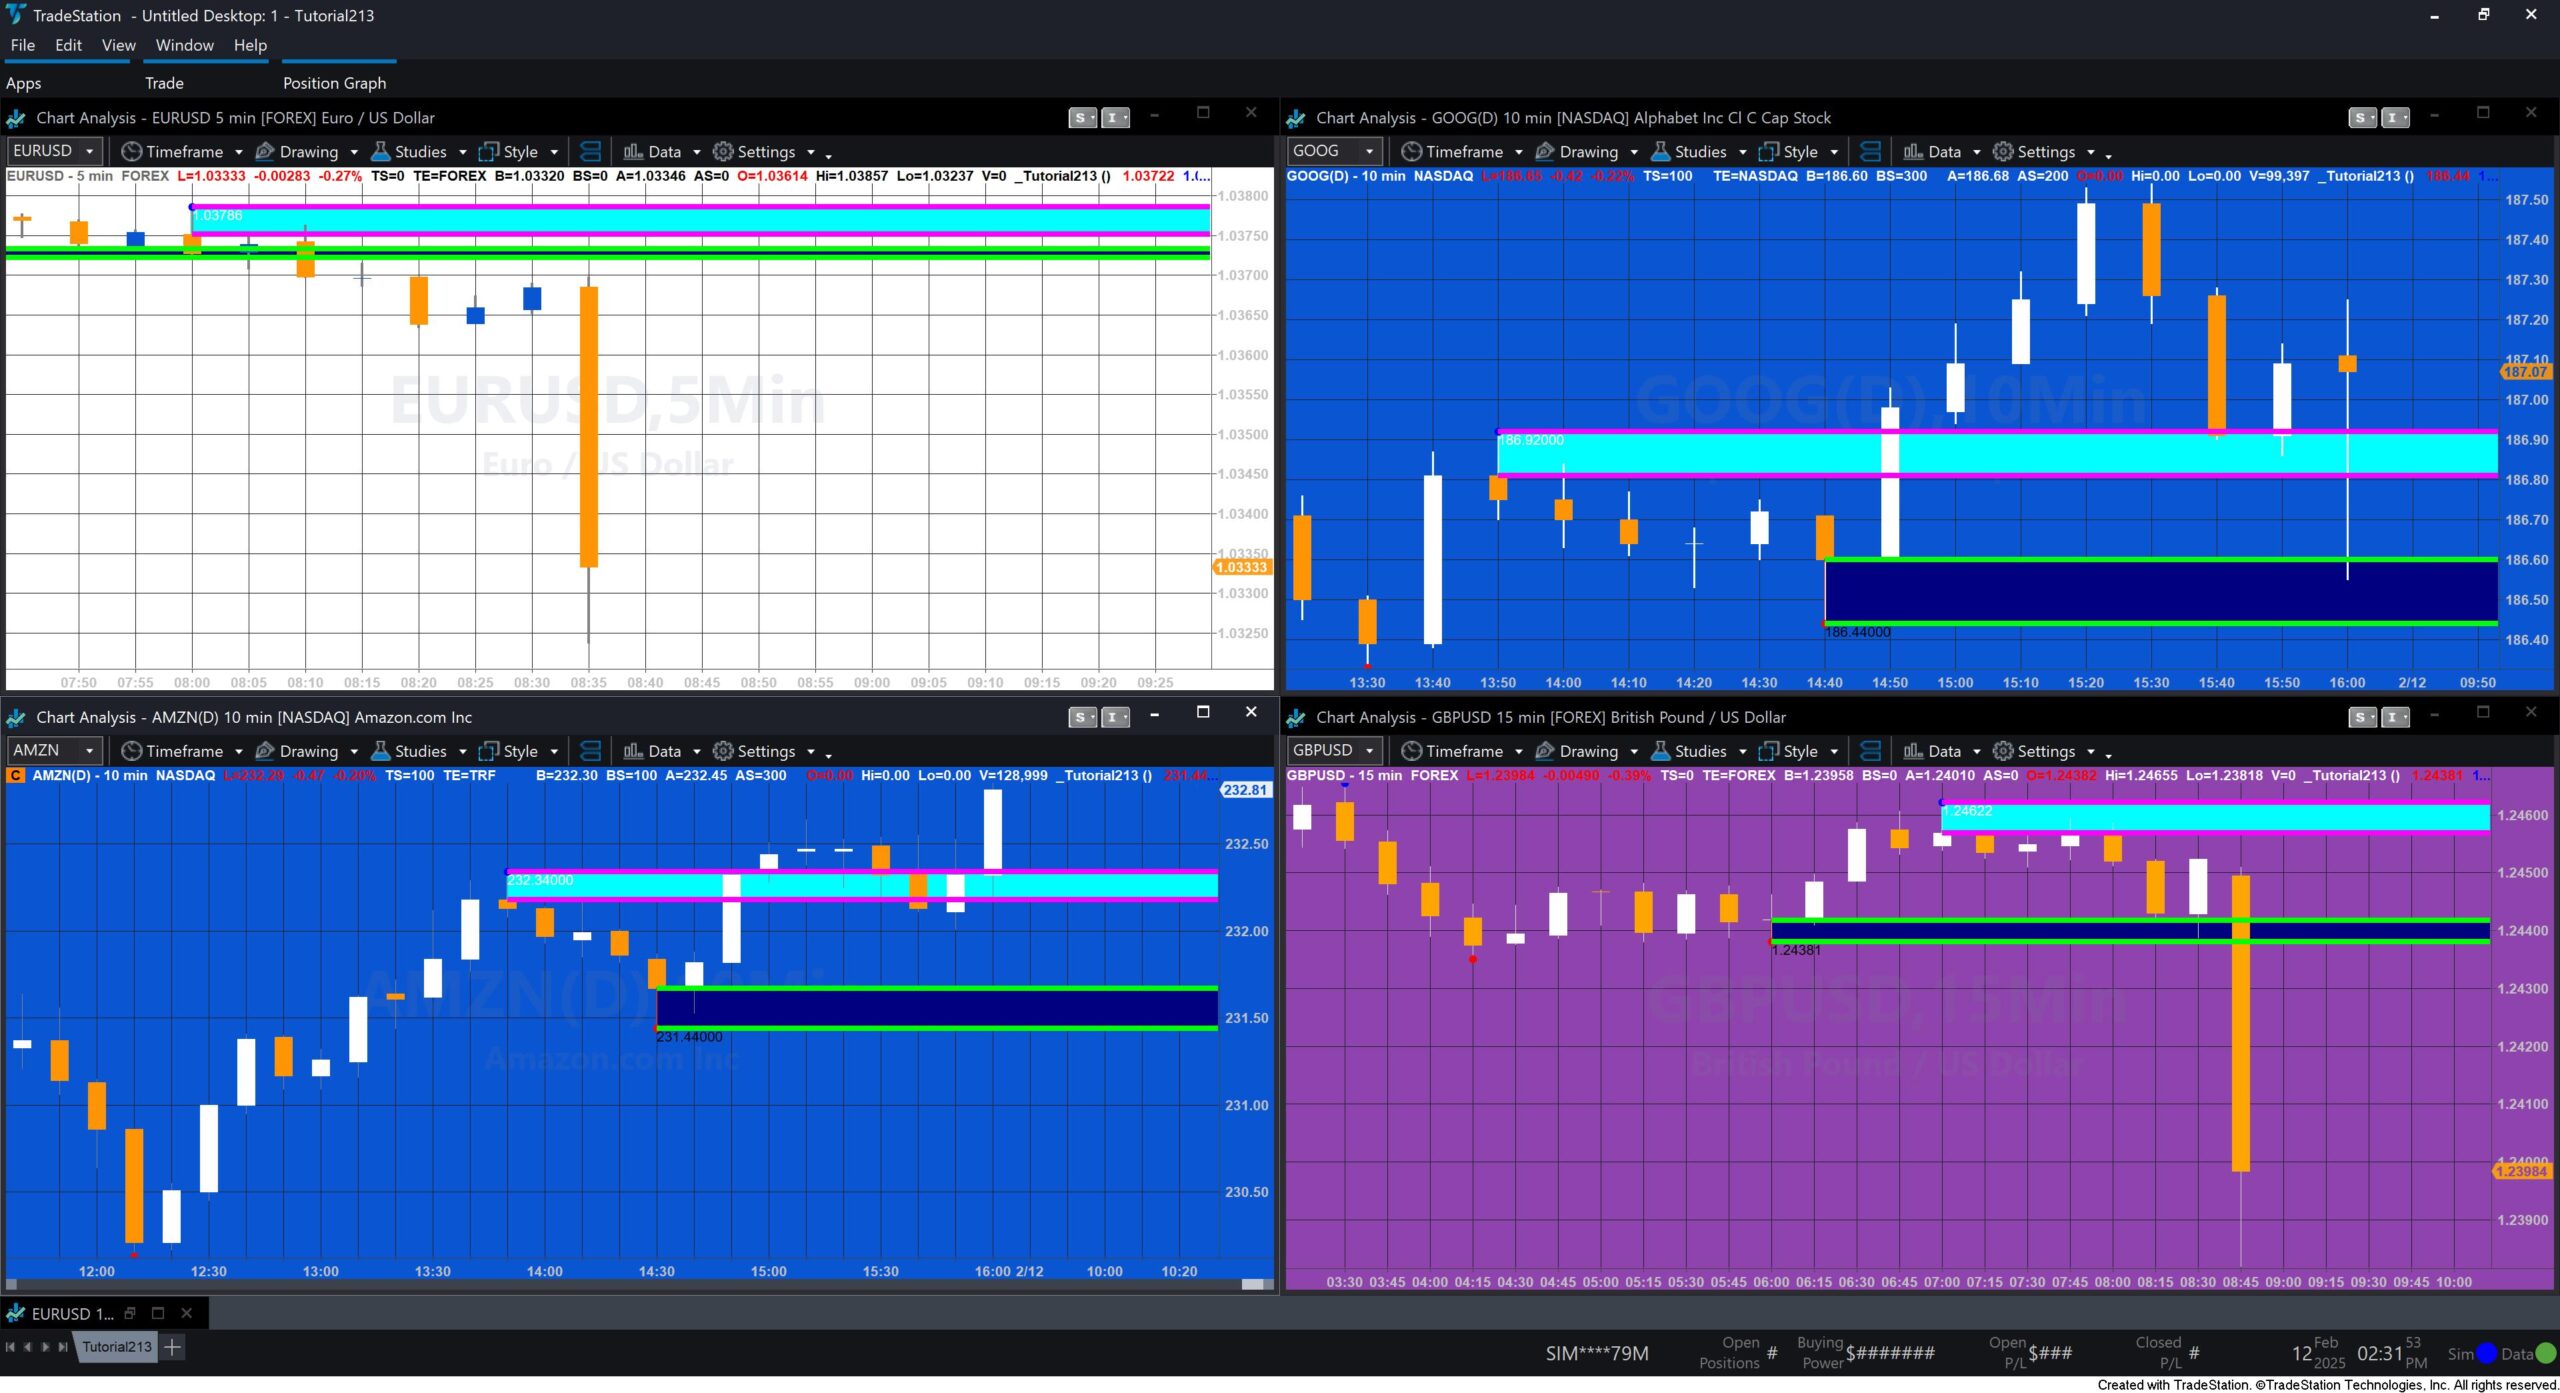
Tutorial 213 explains how to draw horizontal lines at the bottom and top of the wick of the last high and low pivots that occurred. The lines are extended to the right of the chart. The tutorial uses the trendline and the text label objects. In addition, it shows how you can use the rectangle object to fill the area between the two trend lines using rectangle objects. The rectangle is also extended to the right of the chart.
The tutorial demonstrates how to get the correct trendline, rectangle and text label syntax by using the toolbox and then copying code from ‘designer generated code.’
A further example shows how the code and can tidied up by creating a method to draw the trendlines.
Pivots are identified using the standard TradeStation function:
Pivot( Price, Length, LeftStrength, RightStrength, Instance, HiLo, oPivotPrice, oPivotBar )


Explanation of tutorial 213
Download the tutorial 213 program
If you wish to save yourself some typing, the tutorial programs are available for immediate download by clicking the ‘add to cart’ button below. You may pay using PayPal or a credit card. The price is $19.95
Free download of tutorial 213 for Gold Pass members
Download the tutorial 213 TradeStation EasyLanguage Show me study free for Gold Pass members. If you are a Gold Pass member you can download the tutorial code below, please make sure that you are logged in with your Gold Pass user name and password. ![]() This content is for members only.
This content is for members only.
TO THE BEST OF MARKPLEX CORPORATION’S KNOWLEDGE, ALL OF THE INFORMATION ON THIS PAGE IS CORRECT, AND IT IS PROVIDED IN THE HOPE THAT IT WILL BE USEFUL. HOWEVER, MARKPLEX CORPORATION ASSUMES NO LIABILITY FOR ANY DAMAGES, DIRECT OR OTHERWISE, RESULTING FROM THE USE OF THIS INFORMATION AND/OR PROGRAM(S) DESCRIBED, AND NO WARRANTY IS MADE REGARDING ITS ACCURACY OR COMPLETENESS. USE OF THIS INFORMATION AND/OR PROGRAMS DESCRIBED IS AT YOUR OWN RISK.
ANY EASYLANGUAGE OR POWERLANGUAGE TRADING STRATEGIES, SIGNALS, STUDIES, INDICATORS, SHOWME STUDIES, PAINTBAR STUDIES, PROBABILITYMAP STUDIES, ACTIVITYBAR STUDIES, FUNCTIONS (AND PARTS THEREOF) AND ASSOCIATED TECHNIQUES REFERRED TO, INCLUDED IN OR ATTACHED TO THIS TUTORIAL OR PROGRAM DESCRIPTION ARE EXAMPLES ONLY, AND HAVE BEEN INCLUDED SOLELY FOR EDUCATIONAL PURPOSES. MARKPLEX CORPORATION. DOES NOT RECOMMEND THAT YOU USE ANY SUCH TRADING STRATEGIES, SIGNALS, STUDIES, INDICATORS, SHOWME STUDIES, PAINTBAR STUDIES, PROBABILITYMAP STUDIES, ACTIVITYBAR STUDIES, FUNCTIONS (OR ANY PARTS THEREOF) OR TECHNIQUES. THE USE OF ANY SUCH TRADING STRATEGIES, SIGNALS, STUDIES, INDICATORS, SHOWME STUDIES, PAINTBAR STUDIES, PROBABILITYMAP STUDIES, ACTIVITYBAR STUDIES, FUNCTIONS AND TECHNIQUES DOES NOT GUARANTEE THAT YOU WILL MAKE PROFITS, INCREASE PROFITS, OR MINIMIZE LOSSES.

