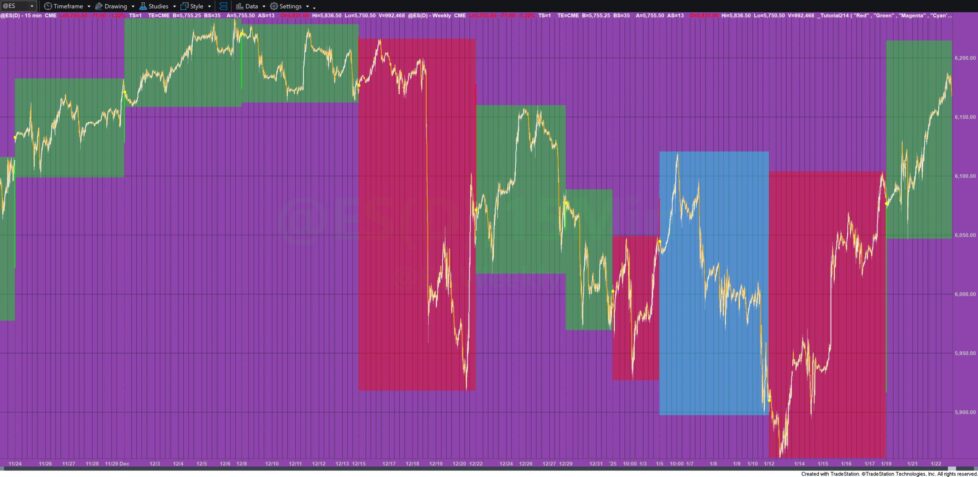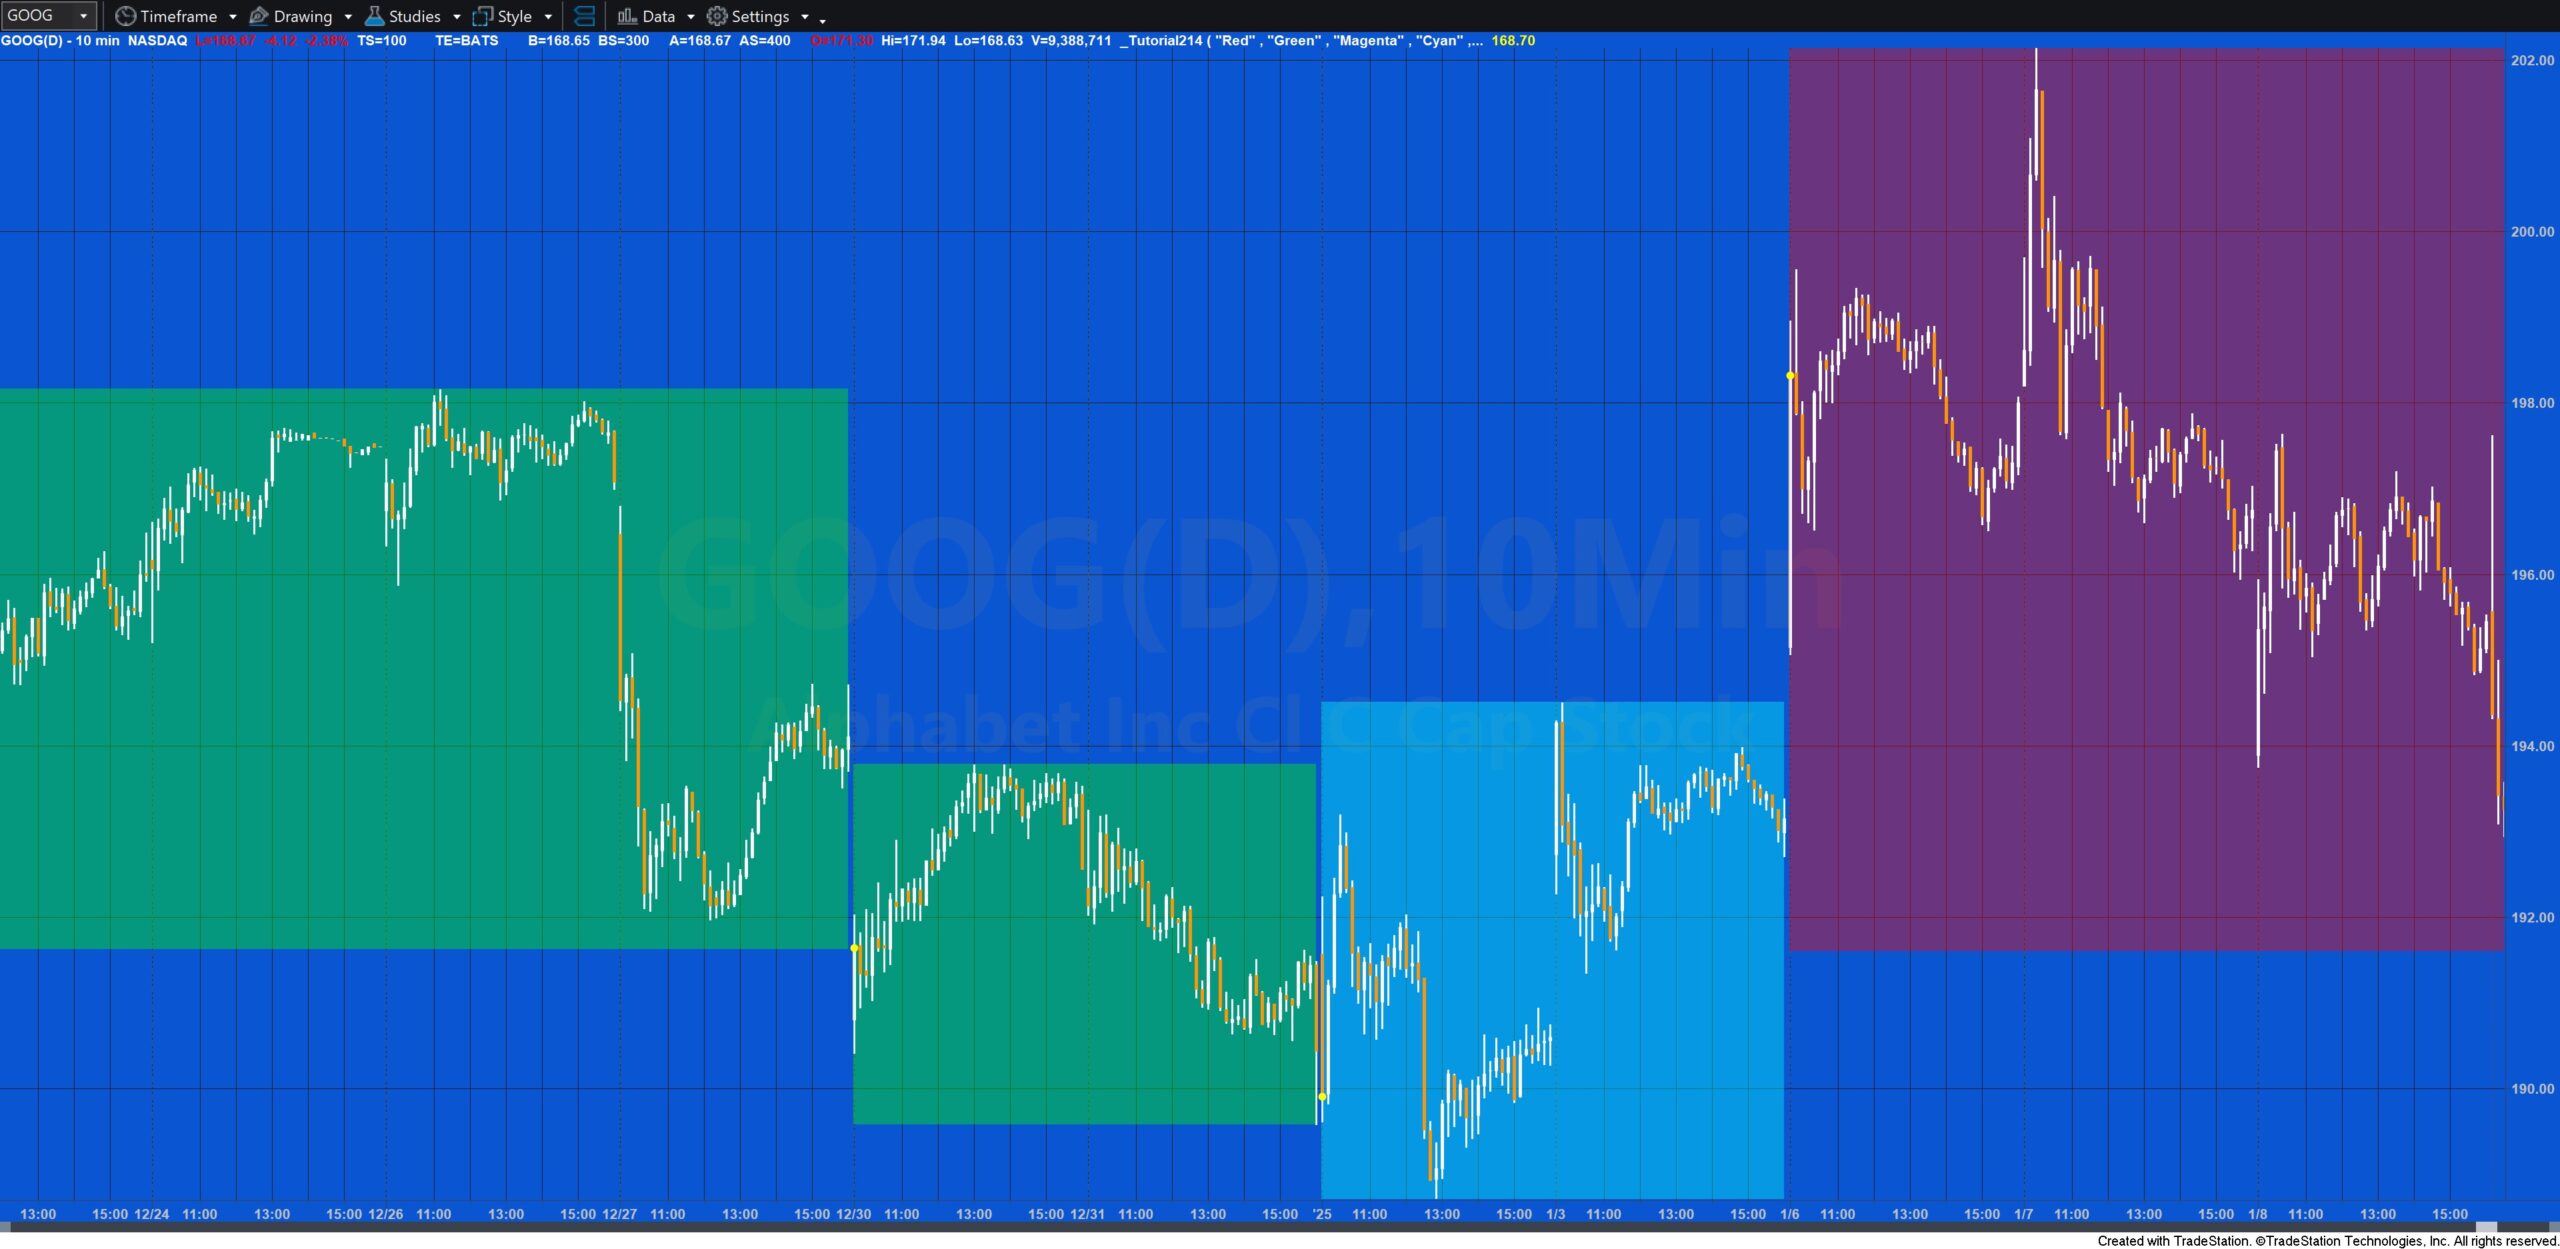
Tutorial 214 explains how to draw a rectangle on a chart each week between the highest high and the lowest low of the week. The tutorial is similar to tutorial 212 which drew boxes for the highest high and lowest low of the DAY rather than the week.
The rectangles for completed weeks in the past are drawn at the start of the new week from the last bar of the previous week to the first bar of the previous week.
The present week is drawn from the last bar on the chart to the first bar of the week and is extended as new bars are added to the chart. At the end of the week this rectangle is deleted.
Among the various programming topics covered in the tutorial are how to:
- convert dates and time to DateTime format
- create DateTime points
- find the week number
- create a method to draw a rectangle (DrawRectangle)
- create a method to change the fill color of a rectangle (ColorRectangle)
The color of the rectangles is based on the highest high and lowest low of the current and previous weeks
as follows:
Current day H – L > Previous Day H – L Color1
Current day H – L < Previous Day H – L Color2
Current day H – L = Previous Day H – L Color3
Current day H > Previous Day H and Current day L < Previous day Low Color4
where Color1, Color2, Color3 and Color4 are user inputs expressed as strings.

Explanation of tutorial 214
Download the tutorial 214 show-me study
If you wish to save yourself some typing, the tutorial is available for immediate download by clicking the ‘add to cart’ button below. You may pay using PayPal or a credit card. The price is $19.95
TO THE BEST OF MARKPLEX CORPORATION’S KNOWLEDGE, ALL OF THE INFORMATION ON THIS PAGE IS CORRECT, AND IT IS PROVIDED IN THE HOPE THAT IT WILL BE USEFUL. HOWEVER, MARKPLEX CORPORATION ASSUMES NO LIABILITY FOR ANY DAMAGES, DIRECT OR OTHERWISE, RESULTING FROM THE USE OF THIS INFORMATION AND/OR PROGRAM(S) DESCRIBED, AND NO WARRANTY IS MADE REGARDING ITS ACCURACY OR COMPLETENESS. USE OF THIS INFORMATION AND/OR PROGRAMS DESCRIBED IS AT YOUR OWN RISK.
ANY EASYLANGUAGE OR POWERLANGUAGE TRADING STRATEGIES, SIGNALS, STUDIES, INDICATORS, SHOWME STUDIES, PAINTBAR STUDIES, PROBABILITYMAP STUDIES, ACTIVITYBAR STUDIES, FUNCTIONS (AND PARTS THEREOF) AND ASSOCIATED TECHNIQUES REFERRED TO, INCLUDED IN OR ATTACHED TO THIS TUTORIAL OR PROGRAM DESCRIPTION ARE EXAMPLES ONLY, AND HAVE BEEN INCLUDED SOLELY FOR EDUCATIONAL PURPOSES. MARKPLEX CORPORATION. DOES NOT RECOMMEND THAT YOU USE ANY SUCH TRADING STRATEGIES, SIGNALS, STUDIES, INDICATORS, SHOWME STUDIES, PAINTBAR STUDIES, PROBABILITYMAP STUDIES, ACTIVITYBAR STUDIES, FUNCTIONS (OR ANY PARTS THEREOF) OR TECHNIQUES. THE USE OF ANY SUCH TRADING STRATEGIES, SIGNALS, STUDIES, INDICATORS, SHOWME STUDIES, PAINTBAR STUDIES, PROBABILITYMAP STUDIES, ACTIVITYBAR STUDIES, FUNCTIONS AND TECHNIQUES DOES NOT GUARANTEE THAT YOU WILL MAKE PROFITS, INCREASE PROFITS, OR MINIMIZE LOSSES.

