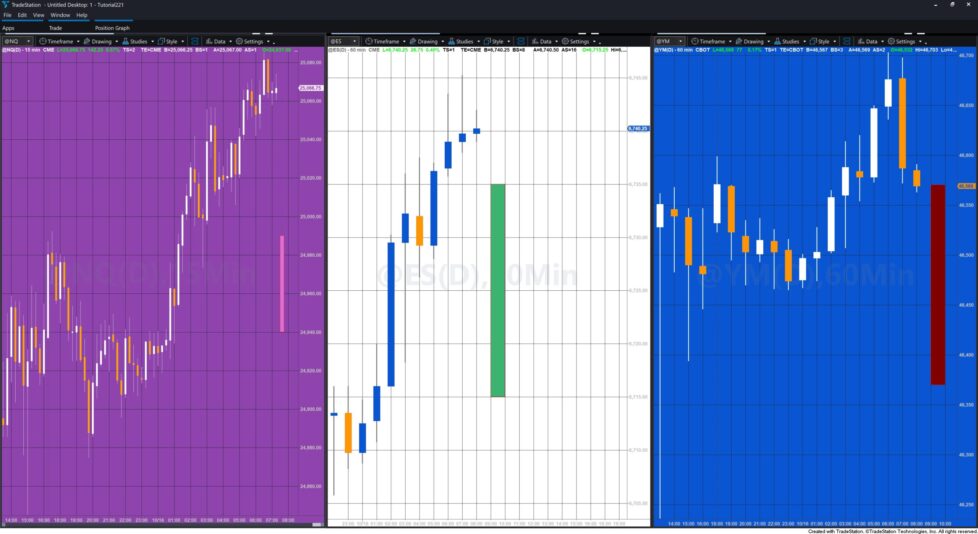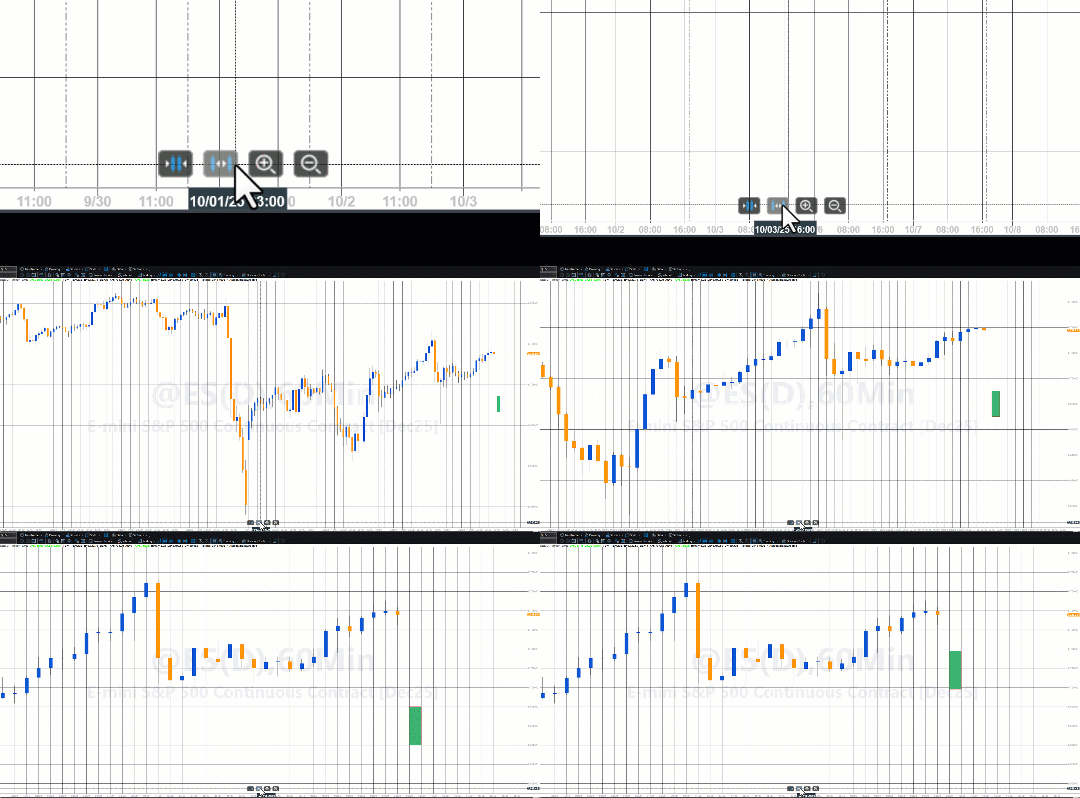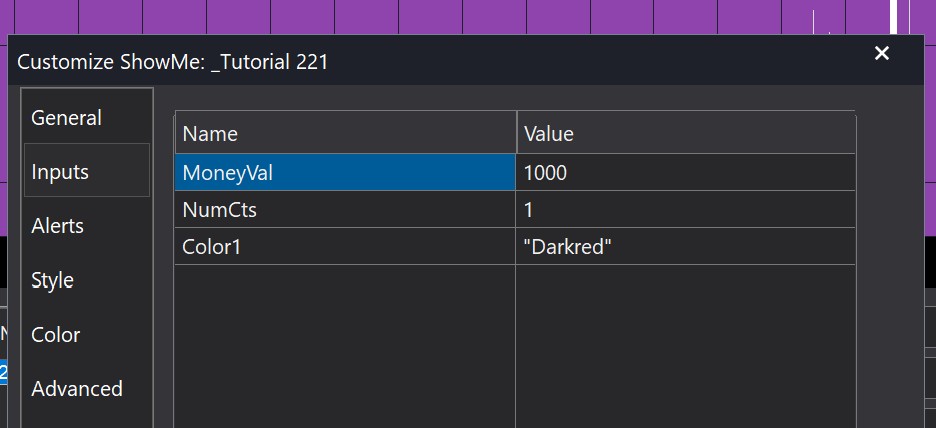
A Gold Pass member requested a set of tutorials and programs to create a “Big Point Ruler” on a chart —a visual tool showing how far the price would need to move to reach a target profit, such as $1,000, based on one contract (or any user-specified dollar amount and number of contracts).
To calculate this, it helps to know the point value — the dollar amount gained or lost for a one-point move in the futures contract. For the most common equity index futures, these values are:
Symbol Contract Multiplier Tick Size Tick Value $ per 1-Point Move
ES E-mini S&P 500 $50 × index 0.25 points $12.50 $50 per point
NQ E-mini Nasdaq-100 $20 × index 0.25 points $5.00 $20 per point
YM E-mini Dow Jones $5 × index 1 point $5.00 $5 per point
For example:
On the @ES (E-mini S&P 500), a $1,000 move requires 20 points ($1,000 ÷ $50 = 20). The Big Point Ruler on an ES chart would therefore span 20 points.
On the @NQ (E-mini Nasdaq-100), it would take 50 points ($1,000 ÷ $20 = 50), so the ruler would be 50 points long.
and on the @YM (E-mini Dow Jones), it would take 200 points ($1,000 ÷ $5 = 200), so the ruler would be 200 points long.
The tutorial demonstrates how to draw and position the rectangle. The Charting Host object is used to detect if the chart is resized and the timer is used to refresh the chart every few seconds.
The syntax for these objects can be found by clicking on the object in the toolbox, selecting the object in the tool tray and then examining and copying the code from the designer generator code. Once the code is copied and pasted into the main program the object must be deleted from the tool tray. This is demonstrated in this tutorial.

A “Trader’s Ruler” (also called a “Big Point Ruler”) is a visual measuring tool that helps traders quickly see how much a symbol’s price must move to achieve a specific dollar gain or loss. Instead of doing mental math or using a calculator to determine how far the market needs to travel for, say, a $1,000 profit, the ruler draws this information directly on the chart. The tool translates a user-defined dollar amount—such as $1,000 per contract—into the corresponding price movement based on the symbol’s Big Point Value and the number of contracts traded. For example, if a futures contract has a Big Point Value of $50 and the user trades two contracts, the ruler would display a $10.00 move (1,000 ÷ (50 × 2)) above and below the current price to show the profit and loss levels.
This “Trader’s Ruler” serves as an intuitive guide for visualizing trade potential and risk. It allows traders to quickly assess whether a given price move is realistic based on recent volatility or chart structure. By adjusting the input parameters—target profit or loss, number of contracts, and optionally tick size—the tool dynamically updates on the chart, helping users plan trades, set stops and targets, or simply understand the market’s reward-to-risk profile. In essence, it transforms abstract dollar goals into clear, price-based visual distances, bridging the gap between strategy planning and chart-based decision-making.

Explanation of tutorial 221
Download the tutorial 221 tutorial
If you wish to save yourself some typing, the tutorial programs are available for immediate download by clicking the ‘add to cart’ button below. You may pay using PayPal or a credit card. The price is $9.95
Free download for Gold Pass members
Download the tutorial 221 TradeStation EasyLanguage example show me study free for Gold Pass members. If you are a Gold Pass member you can download the tutorial code below, please make sure that you are logged in with your Gold Pass user name and password. ![]() This content is for members only.
This content is for members only.
Colors
| AliceBlue | DarkSlateGray | LightSalmon | PaleVioletRed |
| AntiqueWhite | DarkTurquoise | LightSeaGreen | PapayaWhip |
| Aqua | DarkViolet | LightSkyBlue | PeachPuff |
| Aquamarine | DeepPink | LightSlateGray | Peru |
| Azure | DeepSkyBlue | LightSteelBlue | Pink |
| Beige | DimGray | LightYellow | Plum |
| Bisque | DodgerBlue | Lime | PowderBlue |
| Black | Firebrick | LimeGreen | Purple |
| BlanchedAlmond | FloralWhite | Linen | Red |
| Blue | ForestGreen | Magenta | RosyBrown |
| BlueViolet | Fuschia | Maroon | RoyalBlue |
| Brown | Gainsboro | MediumAquamarine | SaddleBrown |
| Burlywood | GhostWhite | MediumBlue | Salmon |
| CadetBlue | Gold | MediumOrchid | SandyBrown |
| Chartreuse | Goldenrod | MediumPurple | SeaGreen |
| Chocolate | Gray | MediumSeaGreen | Seashell |
| Coral | Green | MediumSlateBlue | Sienna |
| CornflowerBlue | GreenYellow | MediumSpringGreen | Silver |
| Cornsilk | Honeydew | MediumTurquoise | SkyBlue |
| Cyan | HotPink | MediumVioletRed | SlateBlue |
| DarkBlue | IndianRed | MidnightBlue | SlateGray |
| DarkBrown | Indigo | MintCream | Snow |
| DarkCyan | Ivory | MistyRose | SpringGreen |
| DarkGoldenrod | Khaki | Moccasin | SteelBlue |
| DarkGray | Lavender | NavajoWhite | Tan |
| DarkGreen | LavenderBlush | Navy | Teal |
| DarkKhaki | LawnGreen | OldLace | Thistle |
| Dark Magenta | LemonChiffon | Olive | Tomato |
| DarkOliveGreen | LightBlue | OliveDrab | Turquoise |
| DarkOrange | LightCoral | Orange | Violet |
| DarkOrchid | LightCyan | OrangeRed | Wheat |
| DarkRed | LightGoldenrodYellow | Orchid | White |
| DarkSalmon | LightGray | PaleGoldenrod | WhiteSmoke |
| DarkSeaGreen | LightGreen | PaleGreen | Yellow |
| DarkSlateBlue | LightPink | PaleTurquoise | YellowGreen |
TO THE BEST OF MARKPLEX CORPORATION’S KNOWLEDGE, ALL OF THE INFORMATION ON THIS PAGE IS CORRECT, AND IT IS PROVIDED IN THE HOPE THAT IT WILL BE USEFUL. HOWEVER, MARKPLEX CORPORATION ASSUMES NO LIABILITY FOR ANY DAMAGES, DIRECT OR OTHERWISE, RESULTING FROM THE USE OF THIS INFORMATION AND/OR PROGRAM(S) DESCRIBED, AND NO WARRANTY IS MADE REGARDING ITS ACCURACY OR COMPLETENESS. USE OF THIS INFORMATION AND/OR PROGRAMS DESCRIBED IS AT YOUR OWN RISK.
ANY EASYLANGUAGE OR POWERLANGUAGE TRADING STRATEGIES, SIGNALS, STUDIES, INDICATORS, SHOWME STUDIES, PAINTBAR STUDIES, PROBABILITYMAP STUDIES, ACTIVITYBAR STUDIES, FUNCTIONS (AND PARTS THEREOF) AND ASSOCIATED TECHNIQUES REFERRED TO, INCLUDED IN OR ATTACHED TO THIS TUTORIAL OR PROGRAM DESCRIPTION ARE EXAMPLES ONLY, AND HAVE BEEN INCLUDED SOLELY FOR EDUCATIONAL PURPOSES. MARKPLEX CORPORATION. DOES NOT RECOMMEND THAT YOU USE ANY SUCH TRADING STRATEGIES, SIGNALS, STUDIES, INDICATORS, SHOWME STUDIES, PAINTBAR STUDIES, PROBABILITYMAP STUDIES, ACTIVITYBAR STUDIES, FUNCTIONS (OR ANY PARTS THEREOF) OR TECHNIQUES. THE USE OF ANY SUCH TRADING STRATEGIES, SIGNALS, STUDIES, INDICATORS, SHOWME STUDIES, PAINTBAR STUDIES, PROBABILITYMAP STUDIES, ACTIVITYBAR STUDIES, FUNCTIONS AND TECHNIQUES DOES NOT GUARANTEE THAT YOU WILL MAKE PROFITS, INCREASE PROFITS, OR MINIMIZE LOSSES.

