
EasyLanguage price/stochastic indicator
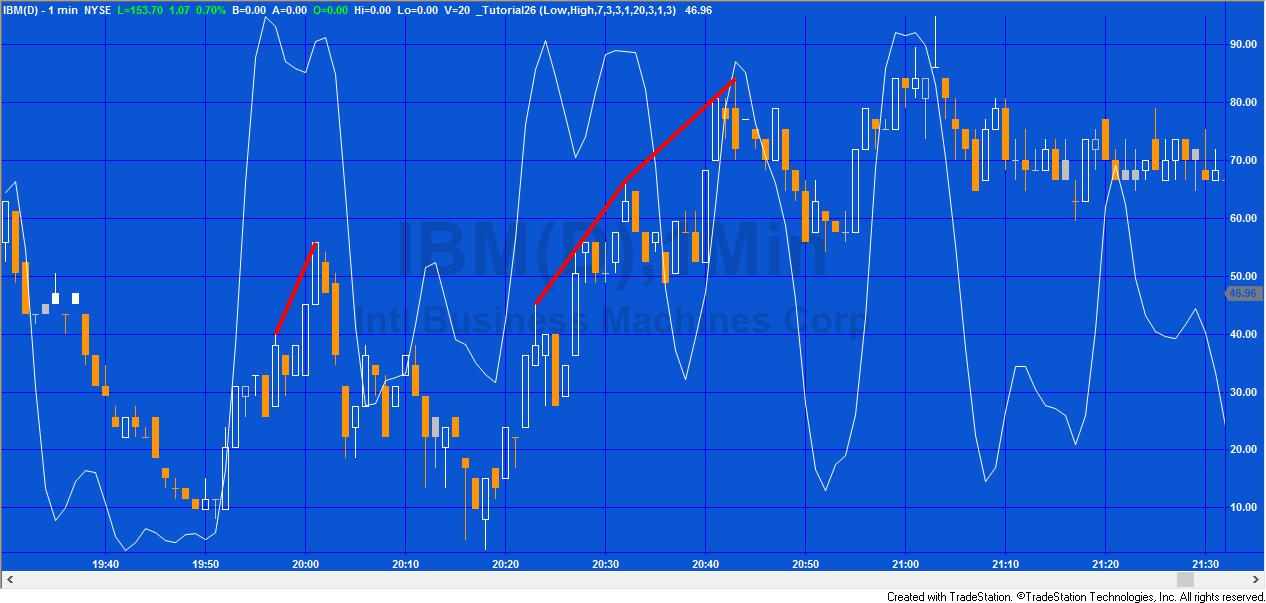
Some technical traders view divergence as indicating a possible change in price direction. This tutorial demonstrates how to create a TradeStation EasyLanguage indicator that looks for divergence between consecutive price and stochastic pivots. If potential divergence is found a line is drawn between the price pivots.
The program works by looking for two low pivots in price over a user input number of bars. It does the same for a stochastic indicator over the same number of bars. If the program finds two low price and two low stochastic pivots it then checks to make sure that:
- The first price and stochastic pivots occurred within a user input number of bars of each other
- The second price and stochastic pivots occurred within a user input number of bars of each other
- There was divergence (i.e. the second price pivot was LOWER than the first price pivot, BUT the second stochastic pivot was HIGHER than the first stochastic pivot
- A price pivot or stochastic just occurred
If all these conditions are fulfilled, a line is drawn between the two price pivots using the TradeStation TL_New functionality.
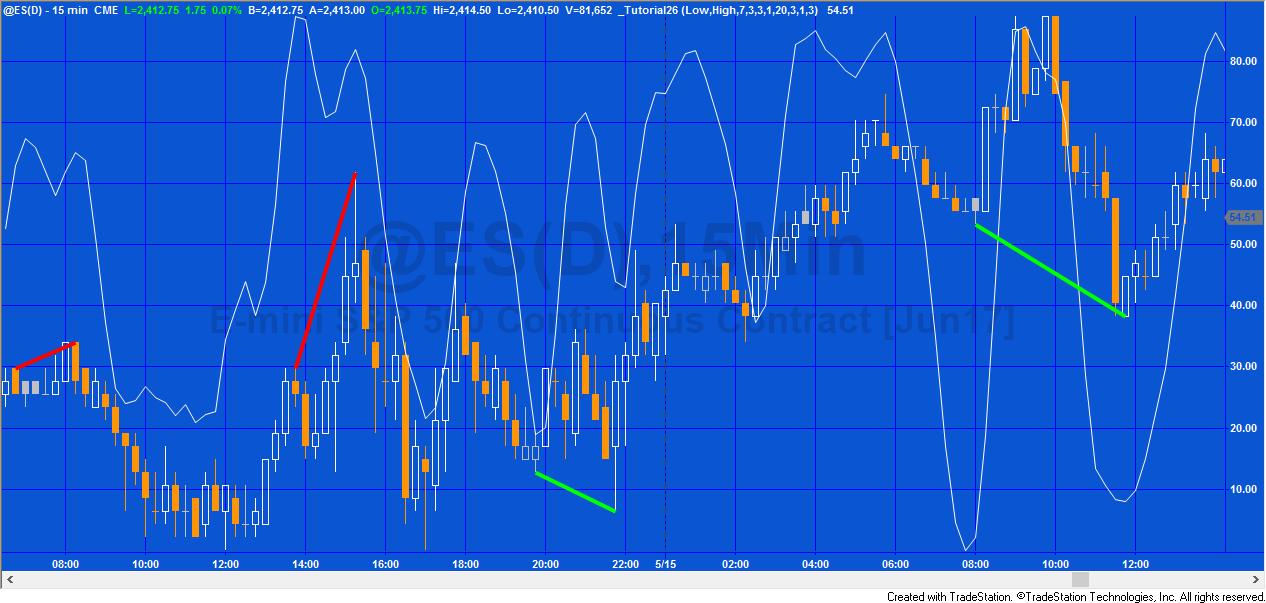
The equivalent functionality is included for high pivots.
Programming lessons
The tutorial demonstrates how to:
- Use the Pivot function to search for price and stochastic pivots
- Check that price and stochastic pivots occurred within a user input number of bars of each other
- Draw lines using the TL_New functionality
This video tutorial explains how to create an indicator that searches for occasions of divergence between price an a stochastic indicator.

To avoid typing the indicator, you may download an ELD for only $29.95:
Video Part 1
In the second part of this tutorial I describe how you can modify the program created above to also look for divergences at the high side (i.e. when a price pivot makes a higher high, or highs are equal, but the top pivot on the stochastic makes a lower high.
Video Part 2
To avoid typing the indicator, you may download an ELD for only $29.95:
If you see any errors in this tutorial – or I have not made something clear, I would be most grateful if you could please contact us. Also, let me know if you have any ideas for new tutorials.
TO THE BEST OF MARKPLEX CORPORATION’S KNOWLEDGE, ALL OF THE INFORMATION ON THIS PAGE IS CORRECT, AND IT IS PROVIDED IN THE HOPE THAT IT WILL BE USEFUL. HOWEVER, MARKPLEX CORPORATION ASSUMES NO LIABILITY FOR ANY DAMAGES, DIRECT OR OTHERWISE, RESULTING FROM THE USE OF THIS INFORMATION AND/OR PROGRAM(S) DESCRIBED, AND NO WARRANTY IS MADE REGARDING ITS ACCURACY OR COMPLETENESS. USE OF THIS INFORMATION AND/OR PROGRAMS DESCRIBED IS AT YOUR OWN RISK.
ANY EASYLANGUAGE OR POWERLANGUAGE TRADING STRATEGIES, SIGNALS, STUDIES, INDICATORS, SHOWME STUDIES, PAINTBAR STUDIES, PROBABILITYMAP STUDIES, ACTIVITYBAR STUDIES, FUNCTIONS (AND PARTS THEREOF) AND ASSOCIATED TECHNIQUES REFERRED TO, INCLUDED IN OR ATTACHED TO THIS TUTORIAL OR PROGRAM DESCRIPTION ARE EXAMPLES ONLY, AND HAVE BEEN INCLUDED SOLELY FOR EDUCATIONAL PURPOSES. MARKPLEX CORPORATION. DOES NOT RECOMMEND THAT YOU USE ANY SUCH TRADING STRATEGIES, SIGNALS, STUDIES, INDICATORS, SHOWME STUDIES, PAINTBAR STUDIES, PROBABILITYMAP STUDIES, ACTIVITYBAR STUDIES, FUNCTIONS (OR ANY PARTS THEREOF) OR TECHNIQUES. THE USE OF ANY SUCH TRADING STRATEGIES, SIGNALS, STUDIES, INDICATORS, SHOWME STUDIES, PAINTBAR STUDIES, PROBABILITYMAP STUDIES, ACTIVITYBAR STUDIES, FUNCTIONS AND TECHNIQUES DOES NOT GUARANTEE THAT YOU WILL MAKE PROFITS, INCREASE PROFITS, OR MINIMIZE LOSSES.