Welcome to tutorial 27 in this series of tutorials to help you learn TradeStation EasyLanguage programming skills. The idea behind the series is that if you learn to program using TradeStation EasyLanguage, then you will have a skill that will enable you to try out trading ideas without the need to use a professional EasyLanguage programmer.
The purpose of this video tutorial is to demonstrate the programming techniques rather than to create a tradable indicator. This tutorial was created using TradeStation version 8.6 and works in all later versions including TradeStation version 10 and MultiCharts.
This video tutorial explains how to create a pivot function that looks for pivots where the prices of successive bars on either side of the pivot are higher, or the highs of successive bars are lower.
If you see any errors in this tutorial – or I have not made something clear, I would be most grateful if you could please let me know. You can e-mail me at: tutorials@markplex.com. Also, let me know if you have any ideas for new tutorials.
Example of how to call the function
{ Syntax to call the function:
_MarkplexPivot( Price, 	Length, LeftStrength, RightStrength, Instance, HiLo, oPivotPrice, oPivotBar  ); }

Vars:	oPivotPrice( 0 ),
		oPivotBar( 0 );

// Plot low Markplex pivots with left strength of 3 and right strength of 2
If _MarkplexPivot( L, 3, 3, 2, 1, -1, oPivotPrice, oPivotBar ) = 1 then Plot1[3]( L[3] );

// Plot high Markplex pivots with left strength of 2 and right strength of 3
If _MarkplexPivot( H, 4, 2, 3, 1, 1, oPivotPrice, oPivotBar ) = 1 then Plot2[4]( H[4] );
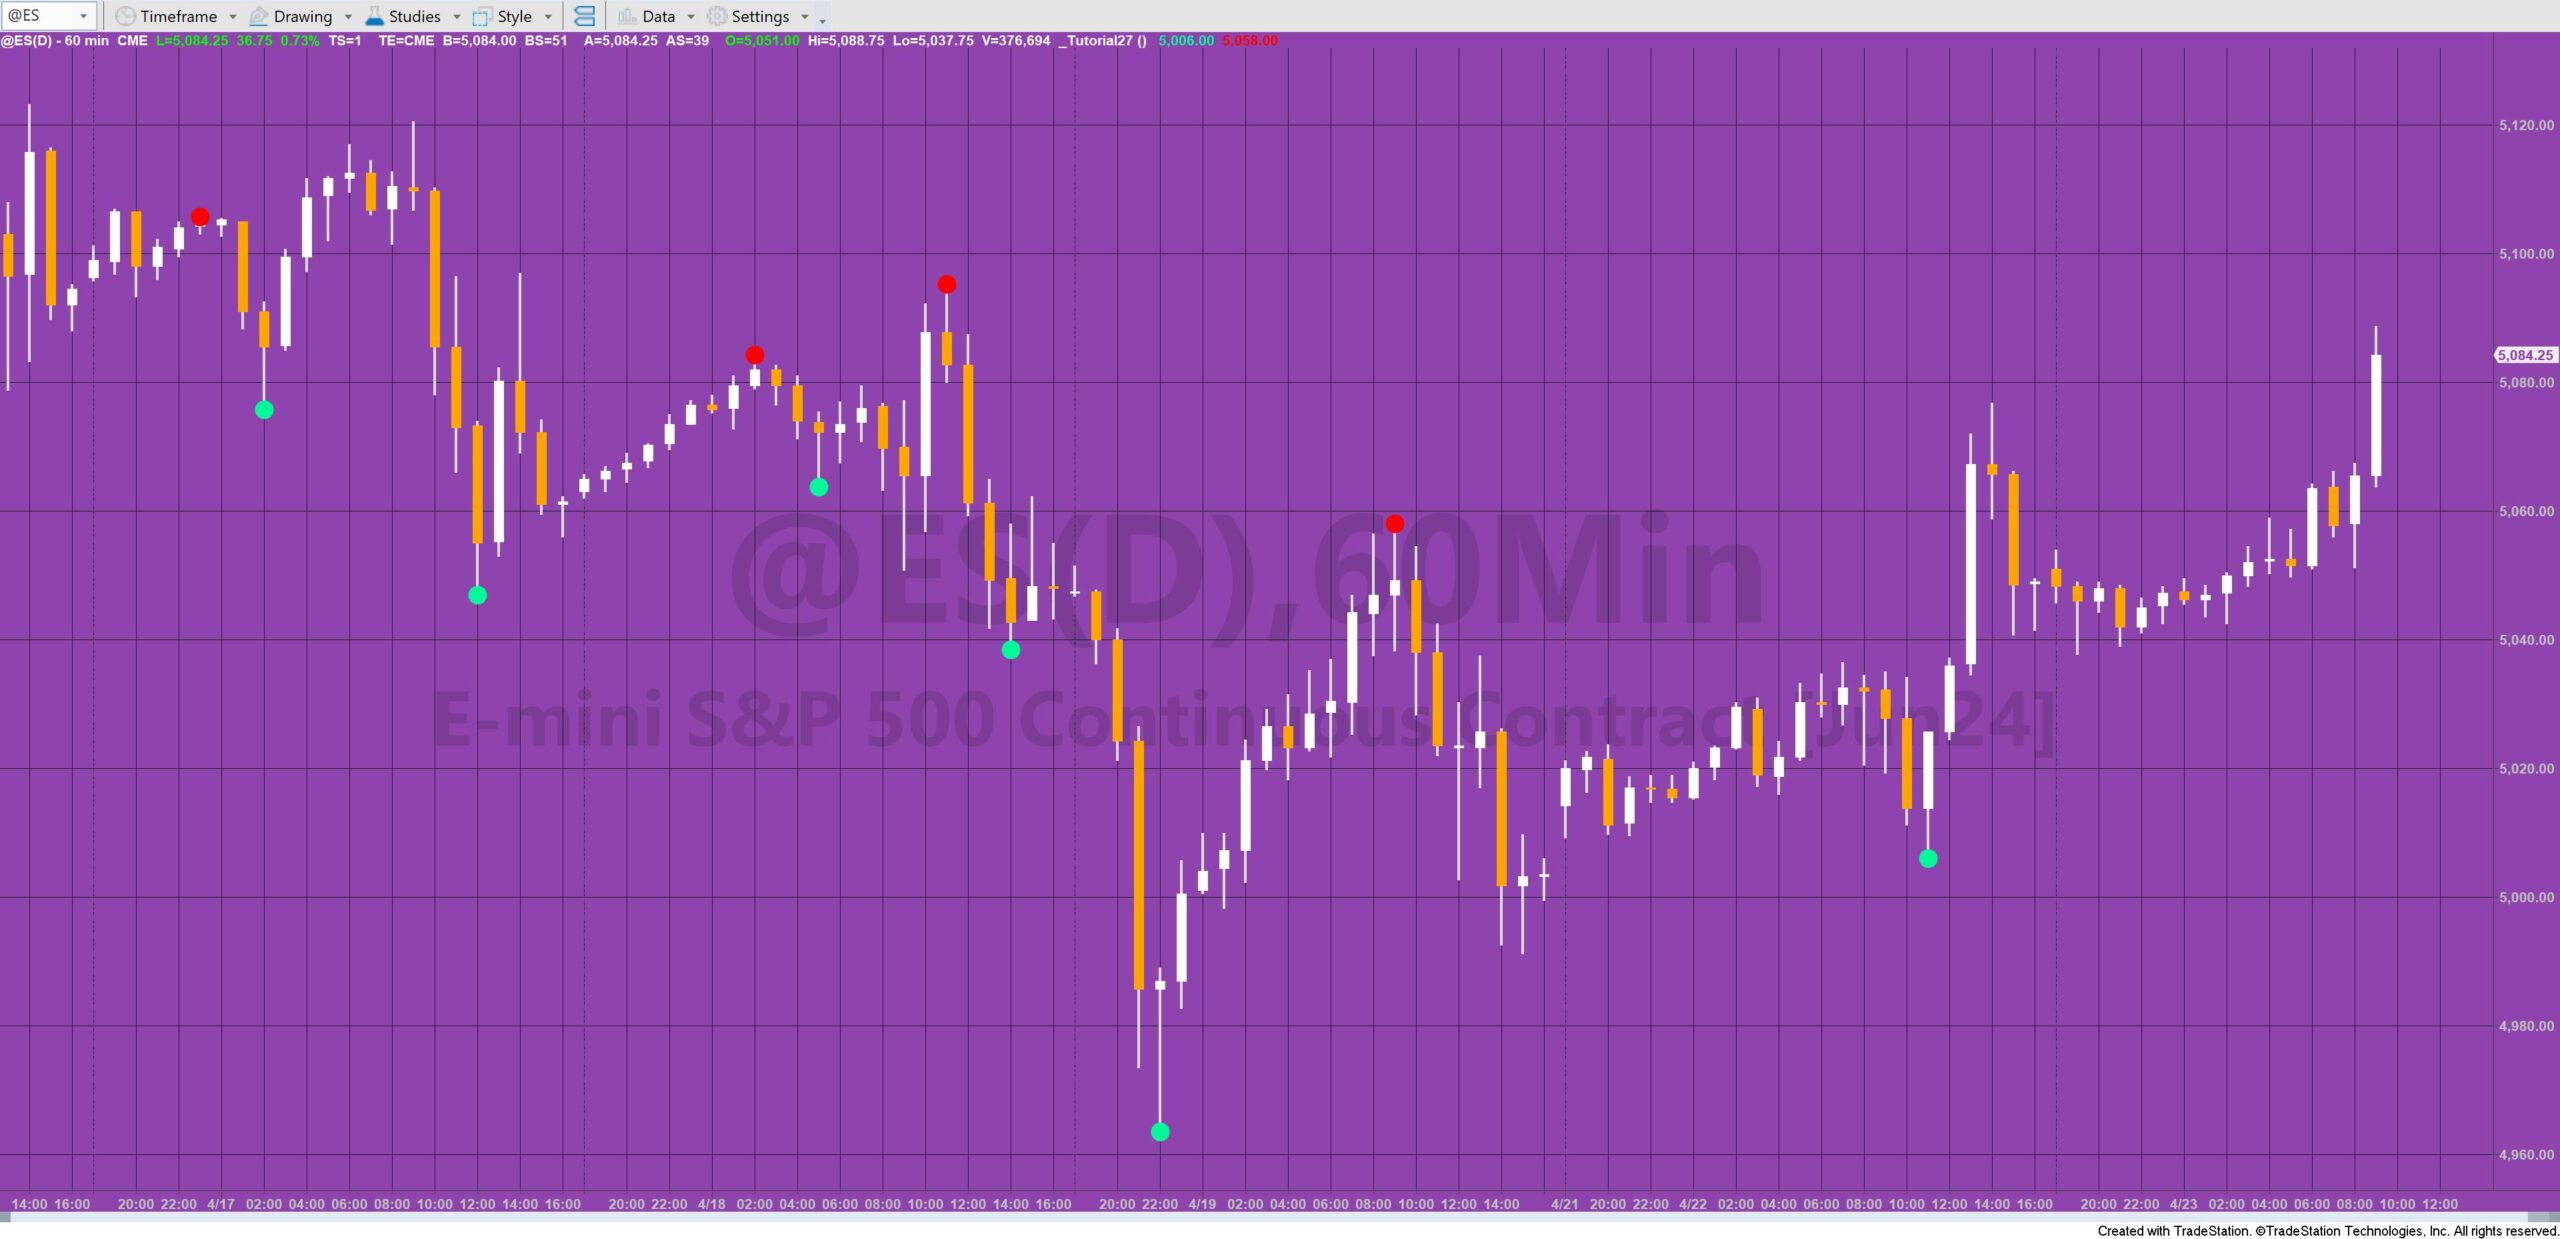
This code should produce results similar to the following when applied to a minute chart.


