
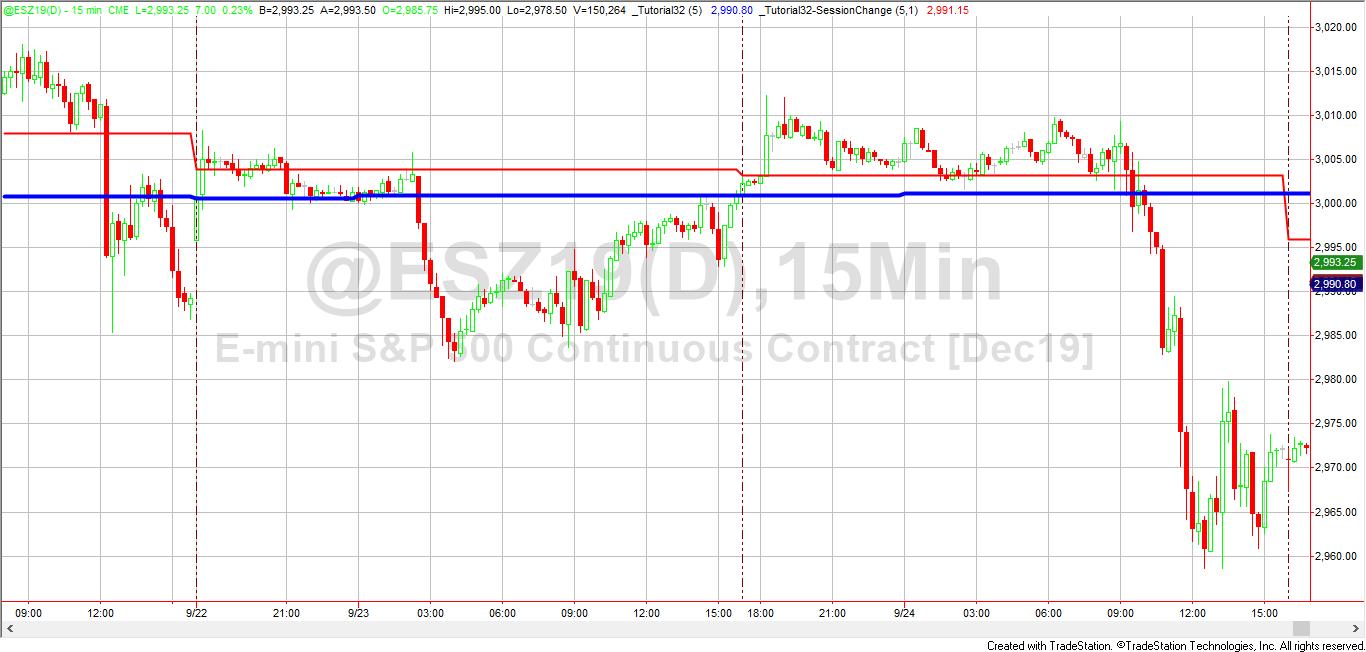
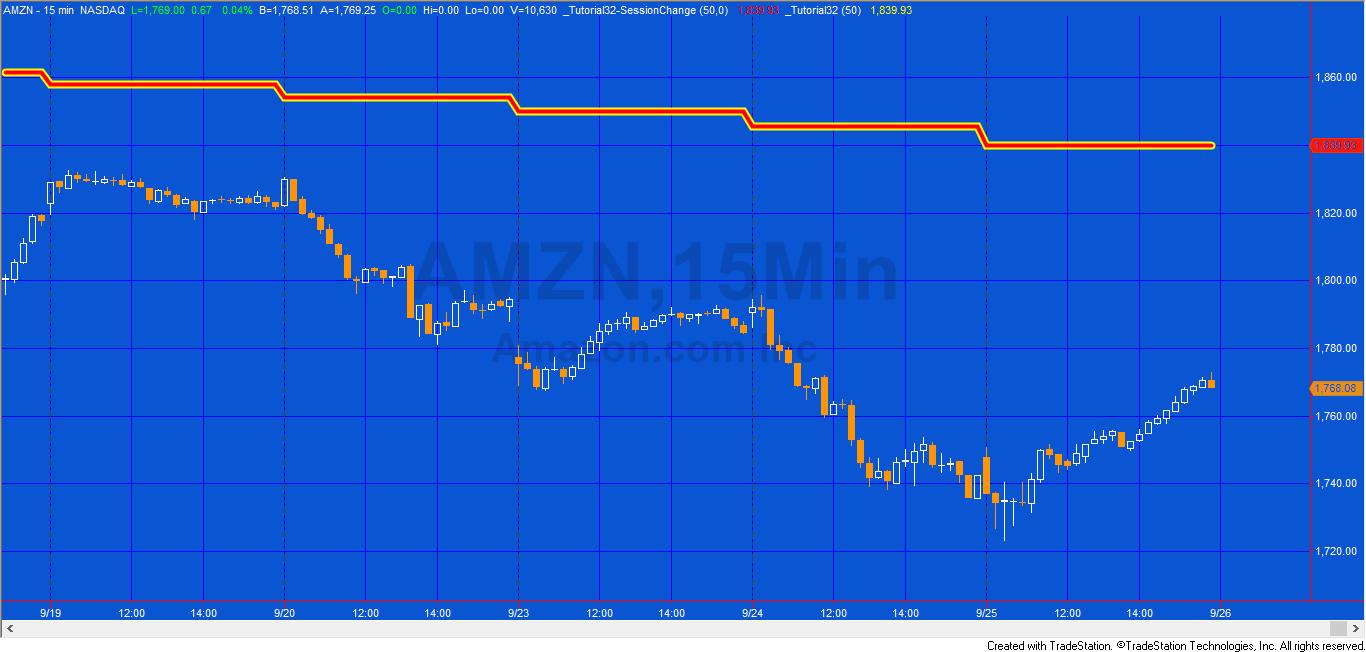
Tutorial 32 calculates and plots a daily moving average on an intraday chart. The user has the option to calculate the average using either:
- the close of the day (like the original tutorial 32)
- or using the session close
In the original tutorial 32 the moving average calculated differed from that calculated using the standard moving average indicator, applied to a daily or 1440 minute chart for a continuous futures contract where the session ended intraday. The main reason for this is that the moving average indicator’s calculations based on when a session is complete (rather than for each new day).
In addition, the close of a daily bar is the exchange provided settlement price, whereas the session close from intraday data is the last traded price.
Tutorial 32a does not use the CloseD function (used in the original tutorial 32) but rather uses a dynamic array to store day or session close information in order to create a daily moving average on an intraday chart.

Download
The unprotected program for TradeStation (version 8.7 and above) and MultiCharts is available for immediate download for $39.95 here:
The ELD includes te new program (_Tutorial32A) and the original program (_Tutorial32).

Tutorial 32a Video
If you see any errors in this tutorial – or something is not clear, please let me know. You can e-mail me at: tutorials@markplex.com.
TO THE BEST OF MARKPLEX CORPORATION’S KNOWLEDGE, ALL OF THE INFORMATION ON THIS PAGE IS CORRECT, AND IT IS PROVIDED IN THE HOPE THAT IT WILL BE USEFUL. HOWEVER, MARKPLEX CORPORATION ASSUMES NO LIABILITY FOR ANY DAMAGES, DIRECT OR OTHERWISE, RESULTING FROM THE USE OF THIS INFORMATION AND/OR PROGRAM(S) DESCRIBED, AND NO WARRANTY IS MADE REGARDING ITS ACCURACY OR COMPLETENESS. USE OF THIS INFORMATION AND/OR PROGRAMS DESCRIBED IS AT YOUR OWN RISK.
ANY EASYLANGUAGE OR POWERLANGUAGE TRADING STRATEGIES, SIGNALS, STUDIES, INDICATORS, SHOWME STUDIES, PAINTBAR STUDIES, PROBABILITYMAP STUDIES, ACTIVITYBAR STUDIES, FUNCTIONS (AND PARTS THEREOF) AND ASSOCIATED TECHNIQUES REFERRED TO, INCLUDED IN OR ATTACHED TO THIS TUTORIAL OR PROGRAM DESCRIPTION ARE EXAMPLES ONLY, AND HAVE BEEN INCLUDED SOLELY FOR EDUCATIONAL PURPOSES. MARKPLEX CORPORATION. DOES NOT RECOMMEND THAT YOU USE ANY SUCH TRADING STRATEGIES, SIGNALS, STUDIES, INDICATORS, SHOWME STUDIES, PAINTBAR STUDIES, PROBABILITYMAP STUDIES, ACTIVITYBAR STUDIES, FUNCTIONS (OR ANY PARTS THEREOF) OR TECHNIQUES. THE USE OF ANY SUCH TRADING STRATEGIES, SIGNALS, STUDIES, INDICATORS, SHOWME STUDIES, PAINTBAR STUDIES, PROBABILITYMAP STUDIES, ACTIVITYBAR STUDIES, FUNCTIONS AND TECHNIQUES DOES NOT GUARANTEE THAT YOU WILL MAKE PROFITS, INCREASE PROFITS, OR MINIMIZE LOSSES.