
UPDATED
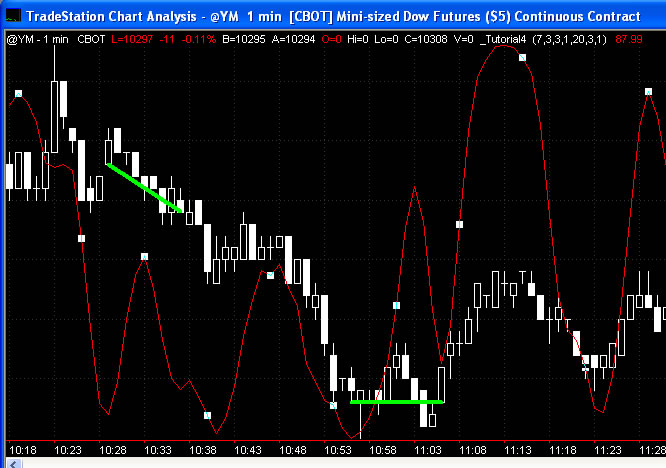
This tutorial looks at the creation of a simple indicator to show divergence between a stochastic indicator and price. In this example we will first look for ‘pivots’ or turning points in the stochastic. For each pair of stochastic pivots we will then look at price. If the price makes a lower low and the stochastic makes a higher low, a line will be drawn on the chart between the 2 prices at the time that the stochastic pivots take place. This indicator could obviously be improved. For instance, the stochastic pivots might not necessarily occur at the same time as pivots in the price. I will look at some possible solutions to this in future tutorials.
This tutorial has been updated since it was originally posted.
TO THE BEST OF MARKPLEX CORPORATION’S KNOWLEDGE, ALL OF THE INFORMATION ON THIS PAGE IS CORRECT, AND IT IS PROVIDED IN THE HOPE THAT IT WILL BE USEFUL. HOWEVER, MARKPLEX CORPORATION ASSUMES NO LIABILITY FOR ANY DAMAGES, DIRECT OR OTHERWISE, RESULTING FROM THE USE OF THIS INFORMATION AND/OR PROGRAM(S) DESCRIBED, AND NO WARRANTY IS MADE REGARDING ITS ACCURACY OR COMPLETENESS. USE OF THIS INFORMATION AND/OR PROGRAMS DESCRIBED IS AT YOUR OWN RISK.
ANY EASYLANGUAGE OR POWERLANGUAGE TRADING STRATEGIES, SIGNALS, STUDIES, INDICATORS, SHOWME STUDIES, PAINTBAR STUDIES, PROBABILITYMAP STUDIES, ACTIVITYBAR STUDIES, FUNCTIONS (AND PARTS THEREOF) AND ASSOCIATED TECHNIQUES REFERRED TO, INCLUDED IN OR ATTACHED TO THIS TUTORIAL OR PROGRAM DESCRIPTION ARE EXAMPLES ONLY, AND HAVE BEEN INCLUDED SOLELY FOR EDUCATIONAL PURPOSES. MARKPLEX CORPORATION. DOES NOT RECOMMEND THAT YOU USE ANY SUCH TRADING STRATEGIES, SIGNALS, STUDIES, INDICATORS, SHOWME STUDIES, PAINTBAR STUDIES, PROBABILITYMAP STUDIES, ACTIVITYBAR STUDIES, FUNCTIONS (OR ANY PARTS THEREOF) OR TECHNIQUES. THE USE OF ANY SUCH TRADING STRATEGIES, SIGNALS, STUDIES, INDICATORS, SHOWME STUDIES, PAINTBAR STUDIES, PROBABILITYMAP STUDIES, ACTIVITYBAR STUDIES, FUNCTIONS AND TECHNIQUES DOES NOT GUARANTEE THAT YOU WILL MAKE PROFITS, INCREASE PROFITS, OR MINIMIZE LOSSES.
The objective of this tutorial is to demonstrate how to draw trend lines on a chart and shows the use of TradeStation’s pivot function.
The following screen grab shows a chart to which this simple demonstration indicator has been applied.
Explanation
If you are unsure as to how to create an EasyLanguage program, see earlier tutorials.
This indicator has three main parts:
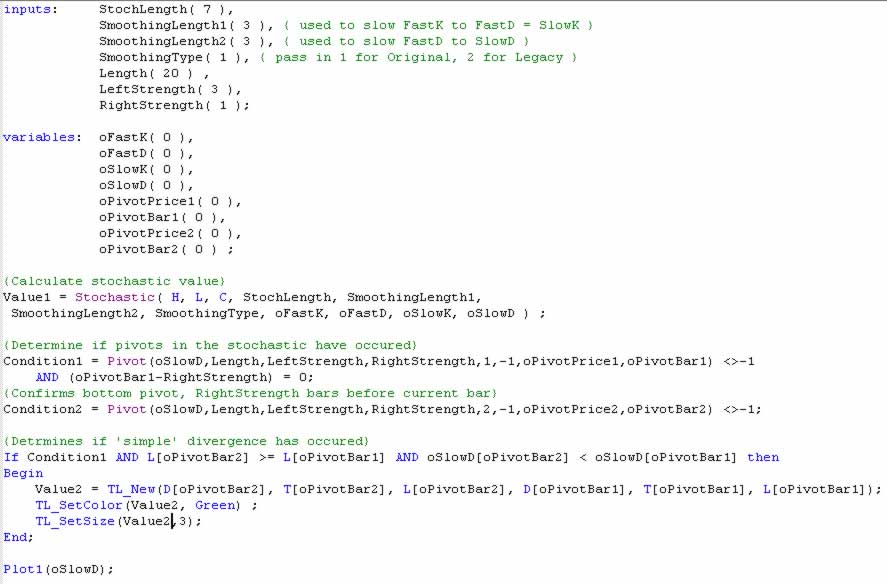
1) The stochastic is calculated using the standard TradeStation Stochastic function. StochLength, SmoothingLength1, SmoothingLength2 and SmoothingType are set as inputs and may be changed by the user of the indicator.
2) The second part of the indicator determines if a pivot has occurred for the stochastic oSlowD value already calculated. In the pivot function:
Length is equal to the number of bars back to look. Left strength is equal to the number of bars that must occur before a pivot and right strength is the number of bars that must occur after a pivot that fulfill the pivot rules. The ‘1’ refers to the most recent pivot and the ‘-1’ indicates that we are looking for a bottom pivot. The function returns two values. oPivotPrice1 is the value of oSlowD at the pivot. oPivotBar1 tells us how many bars ago the pivot in oSlowD occurred.
I have used the pivot function because it allows the left strength and right strengths to be set at different values.
When the above code is TRUE we have the earliest warning that a pivot has occurred.
Condition2 tells us when the next most recent pivot in the oSlowD value occurred, i.e. the pivot BEFORE the most recent one.
3. The third part of the program determines if a ‘simple’ divergence has occurred.
As mentioned above, this statement assumes that the pivots in the price occur at the same time as the stochastic. Of course, this may not be the case. If the above statement is true then a line is drawn on the chart with the following code:
TL_SetColor(Value2, Green) ;
TL_SetSize(Value2,3);
The TL_New statement draws a line from the date, time and value of the low price oPivotBar2 bars ago to the date, time and lower price oPivotBar1 ago. TL_SetColor sets the color for the line. TL_SetSize determines the thickness of the line and may be set at any value from 0 – 6.
Finally the Plot1 statement draws the stochastic value on the chart. To see the stochastic on the same chart as the price, click the mouse on the stochastic and drag it to the price chart.
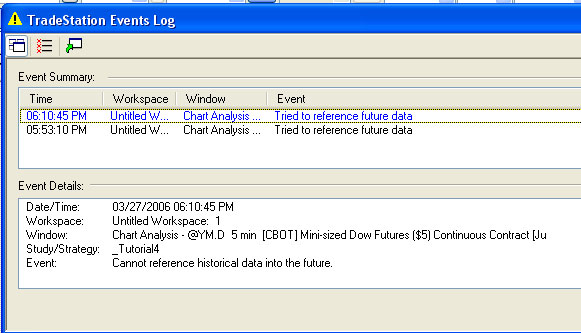
If you apply this indicator to a chart and you are using a later version of TradeStation, you will likely get a message saying that the program tried to reference future data. This is because we failed to check whether Condition2 was true. If it is not true, a value of -1 is placed into the variable oPivotBar2 – and this in turn results in L[oPivotBar2] trying to reference future data (i.e. L[-1]) which is not allowed.
To solve the problem we need to test that Condition2 is TRUE. Modify the program as follows:
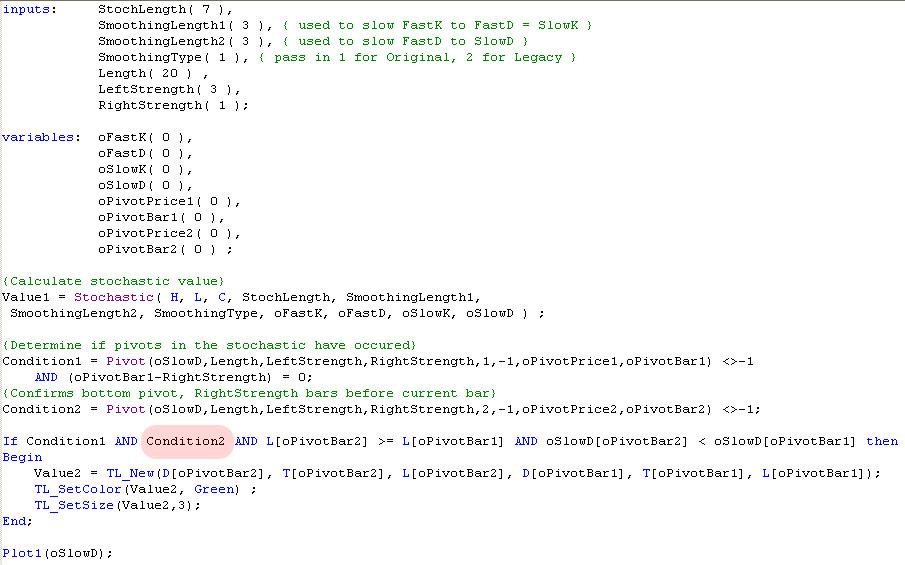
This modification ensures that we do not test for divergence unless we have two confirmed pivots to test.
 If you would like to save yourself some typing, a TradeStation version 9.0 version of the program is available for download for $19.95. The download includes another version of the program that also looks for “bearish” divergences as outlined in the video below.