
Both tutorial programs work with TradeStation (8.7 forward) and MultiCharts.
This tutorial uses the code originally created in tutorial 48 that created a line using linear regression that best fits chart data. The linear regression technique used in this tutorial uses the least squares method to calculate the slope and y-intercept of this line.
The standard deviation of the right most end of the regression line is calculated in order to create a channel made up of two parallel lines above and below the linear regression line. These lines are drawn a user input multiple of standard deviations above and below the original linear regression line.
Finally the tutorial explains how to modify the program developed in tutorial 48 to calculate the standard deviation of the linear regression line’s end point.
Tutorial 49 was created using TradeStation 8.7 and works with all later versions of TradeStation and with Multicharts.
The tutorial includes three different options for displaying the channel:
Option 1
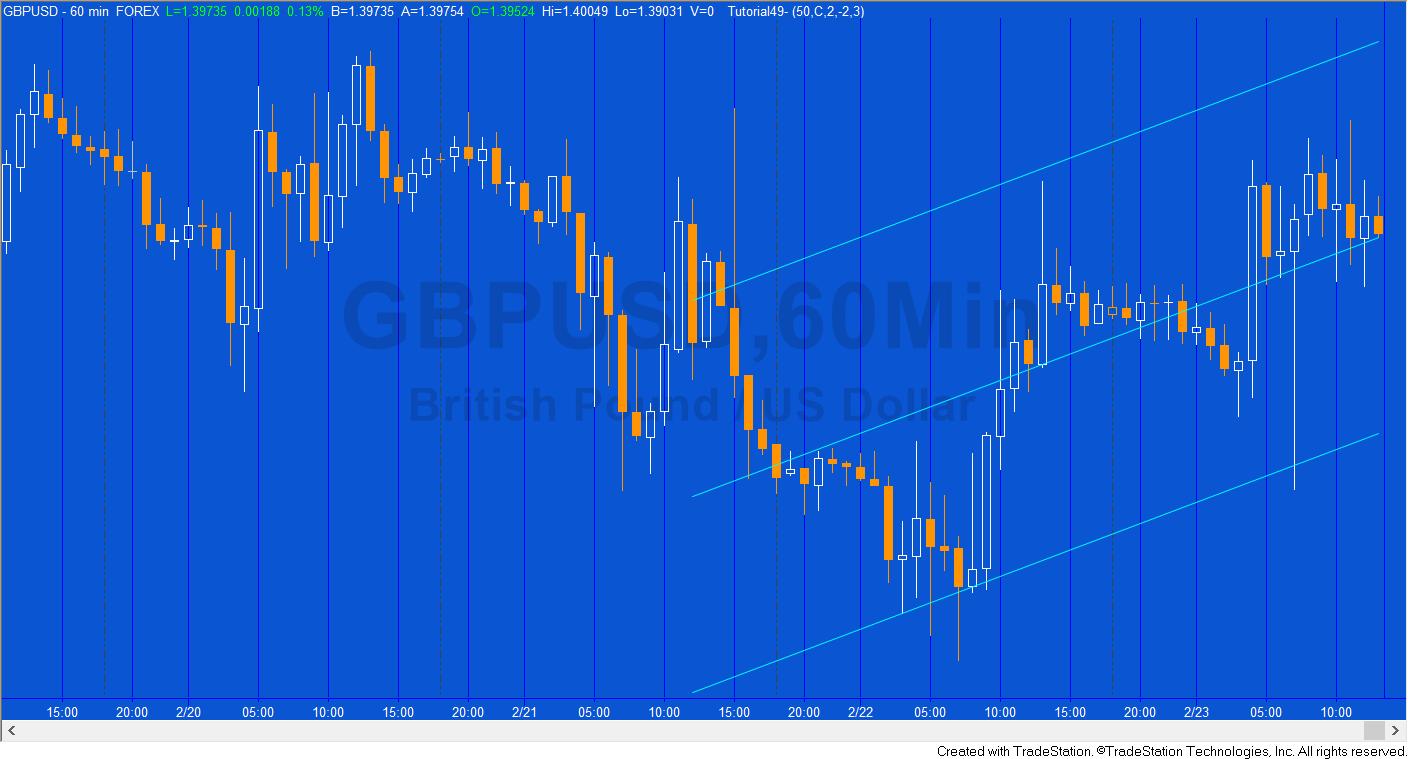
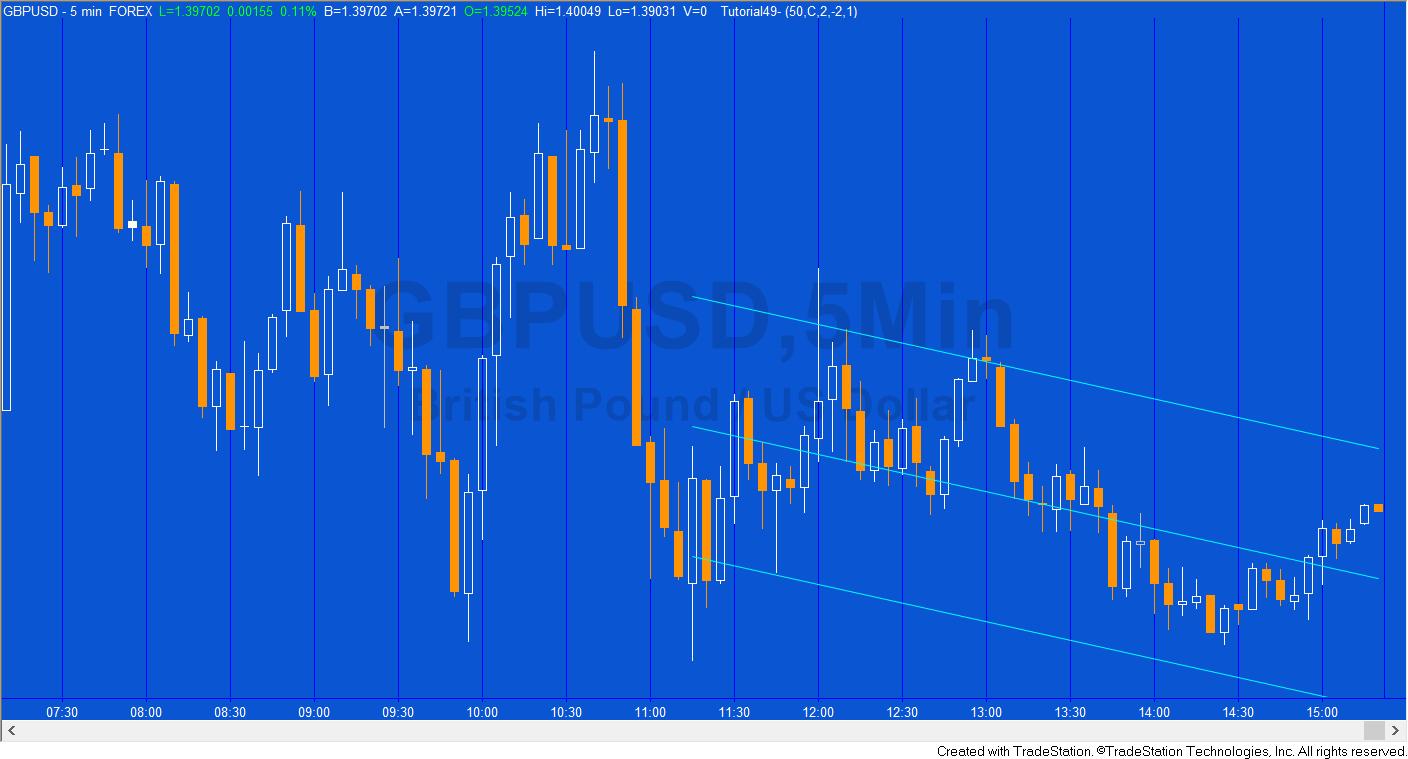
1. In the first option the channel is always moved to the end of the chart to apply to the last NumBars bars.
Option 2
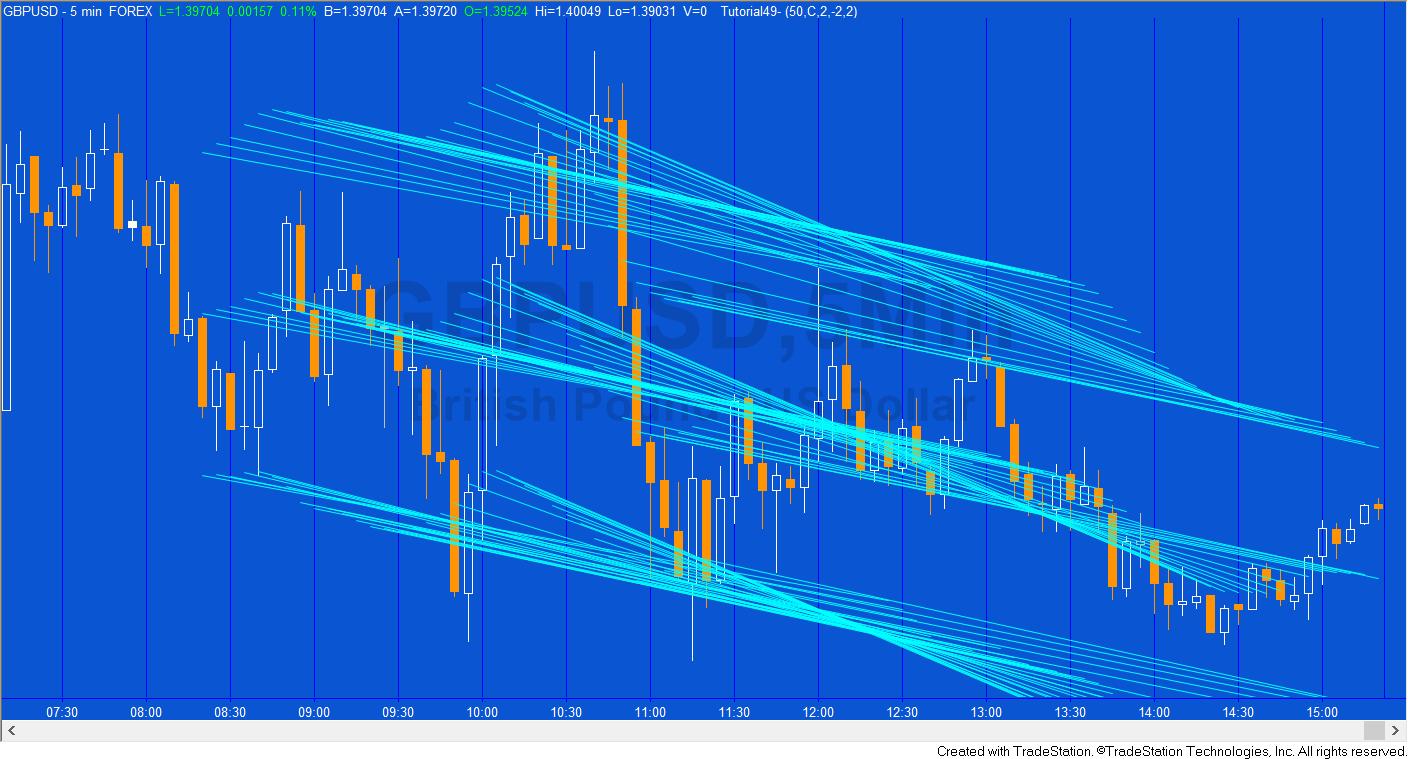
2. A new channel is drawn every time a new bar is printed.
Option 3
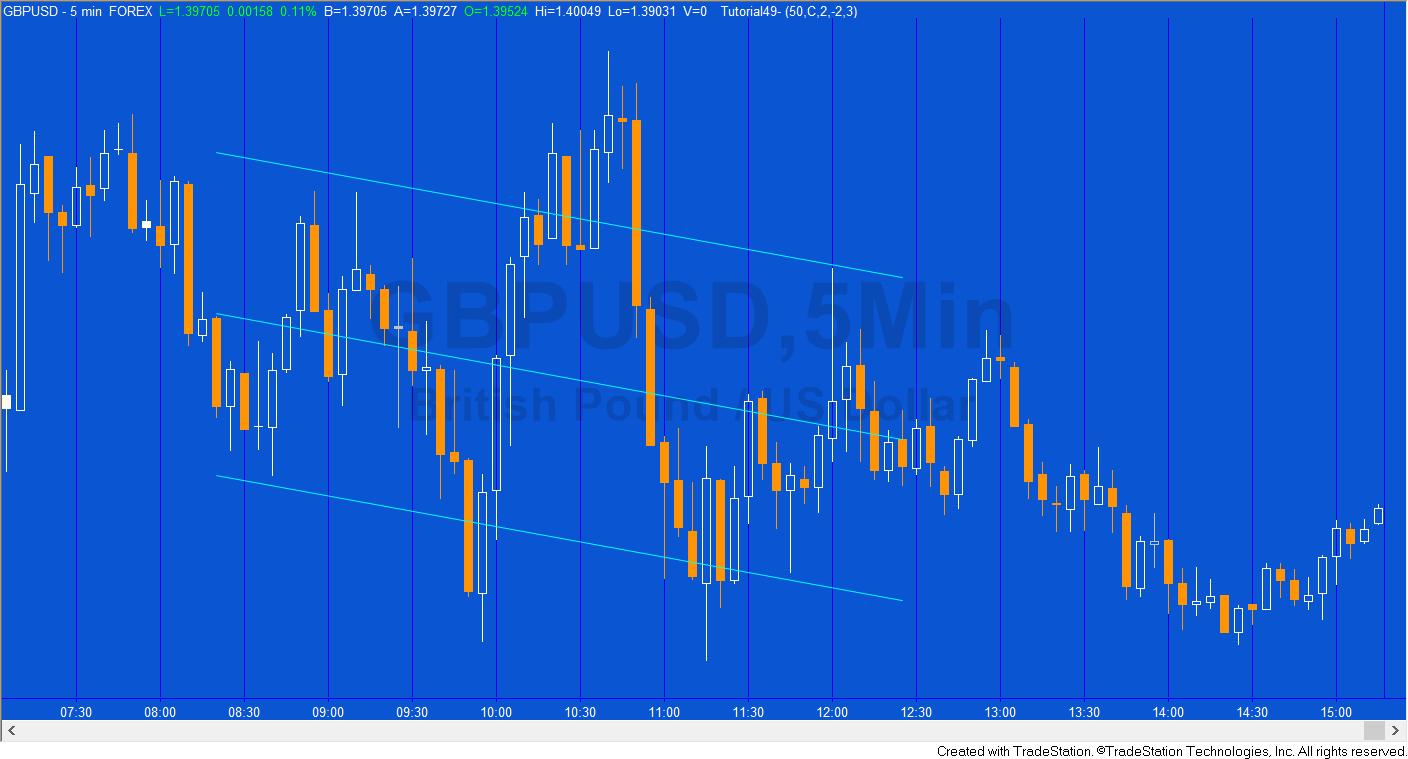
3. The channel is drawn when the show me study is first applied to the chart and doesn’t move.
Tutorial 49 Video 1 – Modifying tutorial 48 to calculate the standard deviation of the end of the linear regression line
Tutorial 49 Video 2
Tutorial 49 Video 3
Tutorial 49 | Modify line colors and styles
Please join our email mailing list if you have not already done so and we will let you know when we release new tutorials or programs.
TO THE BEST OF MARKPLEX CORPORATION’S KNOWLEDGE, ALL OF THE INFORMATION ON THIS PAGE IS CORRECT, AND IT IS PROVIDED IN THE HOPE THAT IT WILL BE USEFUL. HOWEVER, MARKPLEX CORPORATION ASSUMES NO LIABILITY FOR ANY DAMAGES, DIRECT OR OTHERWISE, RESULTING FROM THE USE OF THIS INFORMATION AND/OR PROGRAM(S) DESCRIBED, AND NO WARRANTY IS MADE REGARDING ITS ACCURACY OR COMPLETENESS. USE OF THIS INFORMATION AND/OR PROGRAMS DESCRIBED IS AT YOUR OWN RISK.
ANY EASYLANGUAGE OR POWERLANGUAGE TRADING STRATEGIES, SIGNALS, STUDIES, INDICATORS, SHOWME STUDIES, PAINTBAR STUDIES, PROBABILITYMAP STUDIES, ACTIVITYBAR STUDIES, FUNCTIONS (AND PARTS THEREOF) AND ASSOCIATED TECHNIQUES REFERRED TO, INCLUDED IN OR ATTACHED TO THIS TUTORIAL OR PROGRAM DESCRIPTION ARE EXAMPLES ONLY, AND HAVE BEEN INCLUDED SOLELY FOR EDUCATIONAL PURPOSES. MARKPLEX CORPORATION. DOES NOT RECOMMEND THAT YOU USE ANY SUCH TRADING STRATEGIES, SIGNALS, STUDIES, INDICATORS, SHOWME STUDIES, PAINTBAR STUDIES, PROBABILITYMAP STUDIES, ACTIVITYBAR STUDIES, FUNCTIONS (OR ANY PARTS THEREOF) OR TECHNIQUES. THE USE OF ANY SUCH TRADING STRATEGIES, SIGNALS, STUDIES, INDICATORS, SHOWME STUDIES, PAINTBAR STUDIES, PROBABILITYMAP STUDIES, ACTIVITYBAR STUDIES, FUNCTIONS AND TECHNIQUES DOES NOT GUARANTEE THAT YOU WILL MAKE PROFITS, INCREASE PROFITS, OR MINIMIZE LOSSES.
If you see any errors in this tutorial – or we have not made something clear, we would be most grateful if you could please let us know. E-mail us at: tutorials@markplex.com. Also, let us know if you have any ideas for new tutorials.
EasyLanguage is a programming language that is part of the TradeStation trading platform. It can be used to write programs to help in the technical analysis and trading of foreign exchange (forex or FX), commodities (e.g. the Dow e-mini, S&P e-mini etc), options, and stocks.