
Welcome to tutorial 55 in this series of tutorials designed to help you learn TradeStation EasyLanguage.This tutorial demonstrates the creation of a show me study using TradeStation 8.7. It uses the following formula:
( UpTicks – Downticks ) * VolScaler / ( UpTicks + Downticks );
Where VolScaler is a user input.
To calculate the volume ratio and, if the ratio is above zero it draws it above the bar, otherwise it draws it below the bar.
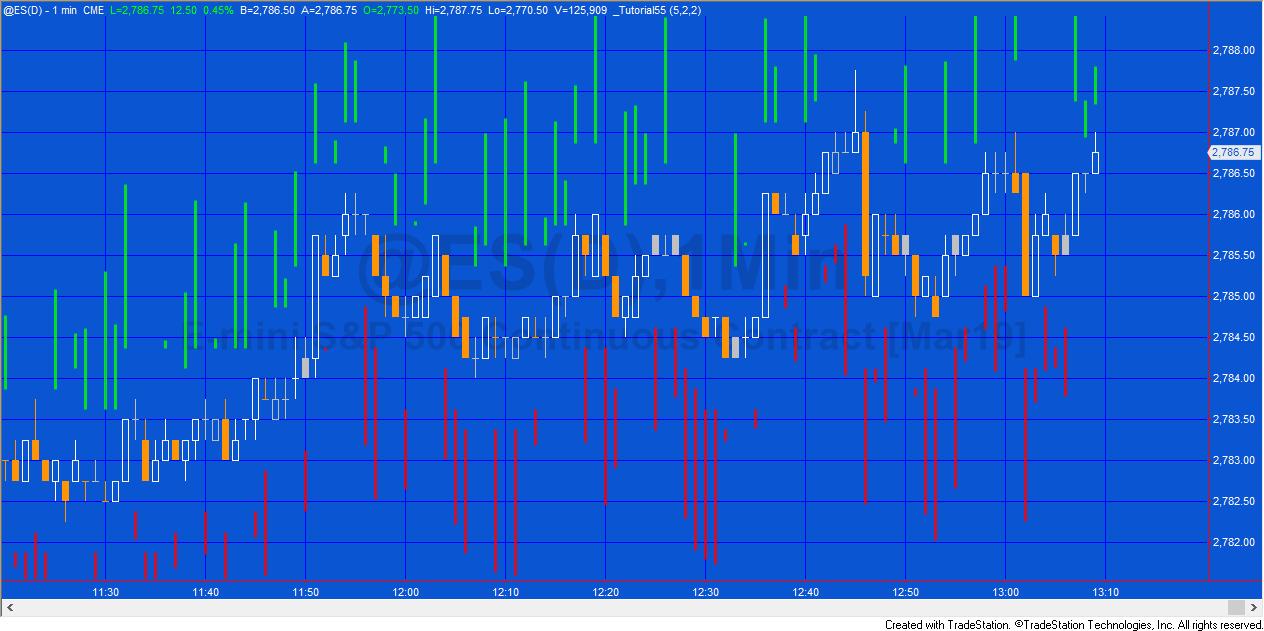
The image on the right shows the program applied to a 1 minute @ES (S&P e-mini) chart.
The tutorial demonstrates the drawing of the lines using the TL_New statement.
The video below explains the tutorial in great detail.
If you wish to download the program for only $14.95 click here:
Please join our email mailing list if you have not already done so and we will let you know when we release new tutorials or programs.
TO THE BEST OF MARKPLEX CORPORATION’S KNOWLEDGE, ALL OF THE INFORMATION ON THIS PAGE IS CORRECT, AND IT IS PROVIDED IN THE HOPE THAT IT WILL BE USEFUL. HOWEVER, MARKPLEX CORPORATION ASSUMES NO LIABILITY FOR ANY DAMAGES, DIRECT OR OTHERWISE, RESULTING FROM THE USE OF THIS INFORMATION AND/OR PROGRAM(S) DESCRIBED, AND NO WARRANTY IS MADE REGARDING ITS ACCURACY OR COMPLETENESS. USE OF THIS INFORMATION AND/OR PROGRAMS DESCRIBED IS AT YOUR OWN RISK.
ANY EASYLANGUAGE OR POWERLANGUAGE TRADING STRATEGIES, SIGNALS, STUDIES, INDICATORS, SHOWME STUDIES, PAINTBAR STUDIES, PROBABILITYMAP STUDIES, ACTIVITYBAR STUDIES, FUNCTIONS (AND PARTS THEREOF) AND ASSOCIATED TECHNIQUES REFERRED TO, INCLUDED IN OR ATTACHED TO THIS TUTORIAL OR PROGRAM DESCRIPTION ARE EXAMPLES ONLY, AND HAVE BEEN INCLUDED SOLELY FOR EDUCATIONAL PURPOSES. MARKPLEX CORPORATION. DOES NOT RECOMMEND THAT YOU USE ANY SUCH TRADING STRATEGIES, SIGNALS, STUDIES, INDICATORS, SHOWME STUDIES, PAINTBAR STUDIES, PROBABILITYMAP STUDIES, ACTIVITYBAR STUDIES, FUNCTIONS (OR ANY PARTS THEREOF) OR TECHNIQUES. THE USE OF ANY SUCH TRADING STRATEGIES, SIGNALS, STUDIES, INDICATORS, SHOWME STUDIES, PAINTBAR STUDIES, PROBABILITYMAP STUDIES, ACTIVITYBAR STUDIES, FUNCTIONS AND TECHNIQUES DOES NOT GUARANTEE THAT YOU WILL MAKE PROFITS, INCREASE PROFITS, OR MINIMIZE LOSSES.
Tutorial 55 Video – Drawing volume ratio lines
If you wish to download the program for only $14.95 click here:
If you see any errors in this tutorial – or we have not made something clear, we would be most grateful if you could please let us know. E-mail us at: tutorials@markplex.com. Also, let us know if you have any ideas for new tutorials.
EasyLanguage is a programming language that is part of the TradeStation trading platform. It can be used to write programs to help in the technical analysis and trading of foreign exchange (forex or FX), commodities (e.g. the Dow e-mini, S&P e-mini etc), options, and stocks.