
TO THE BEST OF MARKPLEX CORPORATION’S KNOWLEDGE, ALL OF THE INFORMATION ON THIS PAGE IS CORRECT, AND IT IS PROVIDED IN THE HOPE THAT IT WILL BE USEFUL. HOWEVER, MARKPLEX CORPORATION ASSUMES NO LIABILITY FOR ANY DAMAGES, DIRECT OR OTHERWISE, RESULTING FROM THE USE OF THIS INFORMATION AND/OR PROGRAM(S) DESCRIBED, AND NO WARRANTY IS MADE REGARDING ITS ACCURACY OR COMPLETENESS. USE OF THIS INFORMATION AND/OR PROGRAMS DESCRIBED IS AT YOUR OWN RISK.
ANY EASYLANGUAGE OR POWERLANGUAGE TRADING STRATEGIES, SIGNALS, STUDIES, INDICATORS, SHOWME STUDIES, PAINTBAR STUDIES, PROBABILITYMAP STUDIES, ACTIVITYBAR STUDIES, FUNCTIONS (AND PARTS THEREOF) AND ASSOCIATED TECHNIQUES REFERRED TO, INCLUDED IN OR ATTACHED TO THIS TUTORIAL OR PROGRAM DESCRIPTION ARE EXAMPLES ONLY, AND HAVE BEEN INCLUDED SOLELY FOR EDUCATIONAL PURPOSES. MARKPLEX CORPORATION. DOES NOT RECOMMEND THAT YOU USE ANY SUCH TRADING STRATEGIES, SIGNALS, STUDIES, INDICATORS, SHOWME STUDIES, PAINTBAR STUDIES, PROBABILITYMAP STUDIES, ACTIVITYBAR STUDIES, FUNCTIONS (OR ANY PARTS THEREOF) OR TECHNIQUES. THE USE OF ANY SUCH TRADING STRATEGIES, SIGNALS, STUDIES, INDICATORS, SHOWME STUDIES, PAINTBAR STUDIES, PROBABILITYMAP STUDIES, ACTIVITYBAR STUDIES, FUNCTIONS AND TECHNIQUES DOES NOT GUARANTEE THAT YOU WILL MAKE PROFITS, INCREASE PROFITS, OR MINIMIZE LOSSES.
In tutorial 5, we looked at the standard Commodity Channel Indicator (CCI) provided by TradeStation and modified it to include fast and slow CCIs together with a zero line. We also added a histogram under the slow CCI. The result, when applied to a chart, looked something like the following:
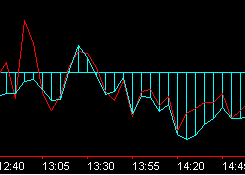
This tutorial takes the CCI indicator and uses it to demonstrate how to ascertain when a pivot has occurred on the CCI plot and how to add text to a price chart. Specifically, we will look to find ‘pivots’ in the CCI that occur on, or near, the zero line.
Please note that any EasyLanguage trading strategies, indicators, showme studies, paintbar studies, probabilitymap studies, activitybar studies, functions (and parts thereof) and associated techniques included in or attached to this tutorial are examples only, and have been included solely for educational purposes. does not recommend that you use any such trading strategies, indicators, showme studies, paintbar studies, probabilitymap studies, activitybar studies, functions (or any parts thereof) or techniques. The use of any such trading strategies, indicators, showme studies, paintbar studies, probabilitymap studies, activitybar studies, functions and techniques does not guarantee that you will make profits, increase profits, or minimize losses.
Step 1
EasyLanguage has a built in Pivot function. The following code searches for pivots in the slow (colored cyan in my example) CCI line.
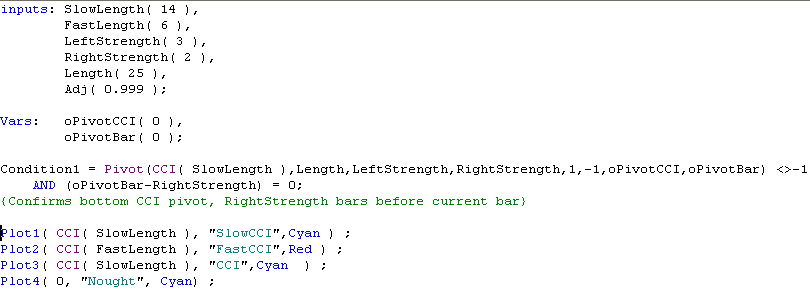
Modify the EasyLanguage study from Tutorial 5 by adding the inputs, variables and the following statement:
Condition1 = Pivot(CCI( SlowLength ),Length,LeftStrength,RightStrength,1,-1,oPivotCCI,oPivotBar) <>-1
AND (oPivotBar-RightStrength) = 0;
When you have entered these lines, click on the word ‘Pivot’ with your right mouse button. The built-in TradeStation help functions will explain the inputs and outputs for the Pivot function. In summary:
CCI( SlowLength ) is the line on which we are looking for a pivot
Length is how many bars back we are going to examine in looking for this pivot.
LeftStrength and RightStrength determine the ‘strength’ of the pivot.
‘1‘ indicates that we are looking for the most recent pivot.
‘-1’ indicates that we are looking for a bottom pivot (or valley).
oPivotCCI and oPivotBar are the outputs from this function. oPivotCCI tells us the value of the CCI at the pivot and oPivotBar tells us how many bars ago that the CCI pivot occurred
(oPivotBar-RightStrength) = 0 tells us that the pivot occurred exactly RightStrength bars ago.
Step 2
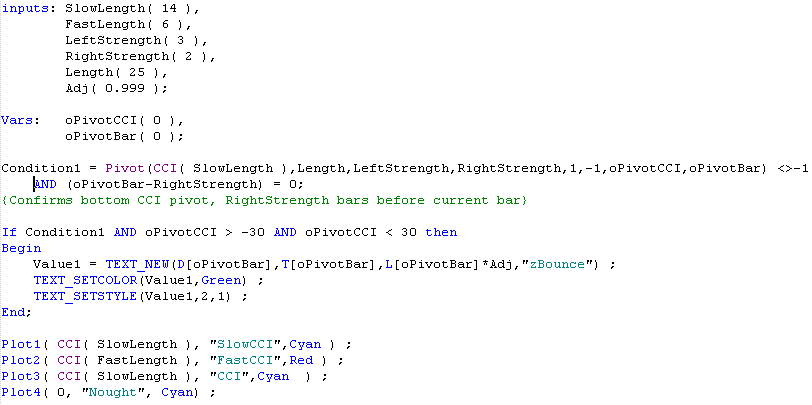
To complete the modifications add the following statement below the pivot line:
If Condition1 AND oPivotCCI > -30 AND oPivotCCI < 30 then
Begin
Value1 = TEXT_NEW(D[oPivotBar],T[oPivotBar],L[oPivotBar]*Adj,”zBounce”) ;
TEXT_SETCOLOR(Value1,Green) ;
TEXT_SETSTYLE(Value1,2,1) ;
End;
Your code should now appear as below:
The first part of the statement:
Condition1 AND oPivotCCI > -30 AND oPivotCCI < 30 is true when there is a pivot in the CCI AND at the pivot bar, the value of the CCI is between -30 and +30.
The second part of the statement ‘prints’ a statement on our chart when a zero ‘bounce’ has occurred. By inputting the program and right-clicking on a particular part of the syntax, you will get an explanation of what the function achieves. In brief:
Value1 = TEXT_NEW(D[oPivotBar],T[oPivotBar],L[oPivotBar]*Adj,”zBounce”) ;
Adds text to the chart.at the date (D[oPivotBar]) and time T[oPivotBar] of the pivot bar. The text is printed just below the low of the bar using the ‘*Adj* statement (L[oPivotBar]*Adj) and the text ‘zBounce‘ is printed. The reference ID for the text is assigned to Value1.
TEXT_SETCOLOR(Value1,Green) ;
This statement sets the color of the text whose reference ID is Value1.
TEXT_SETSTYLE(Value1,2,1) ;
This statement sets the style of the text whose reference ID is Value1
Step 3
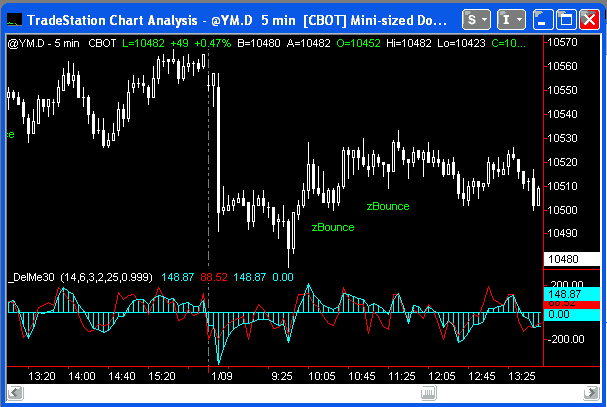
When the indicator is completed, it should be verified and then applied to a chart. The result should look something like this:
Summary
This tutorial demonstrates the use of the pivot function applied to an indicator. It also demonstrates the use of the TEXT_NEW function to add text to a chart when certain conditions occur.