

Welcome to tutorial 63 in this series of tutorials designed to demonstrate TradeStation EasyLanguage programming techniques.
The tutorial builds on the work done in tutorial 60 that showed how to draw a trend line on a Commodity Channel Index (CCI) chart by joining pivots and searches for places where the CCI crosses the trend line.
I was asked by a client, how a program, such as the one created in tutorial 60, could be used to screen a number of stocks. An ideal way of doing this is to use TradeStation RadarScreen.
This tutorial takes the tutorial 60 program and demonstrates what changes need to be made so that it will work correctly on RadarScreen. Specifically, the trend lines used in tutorial 60 both show the trend lines visually, an are used to find the value of the trend line for any particular bar. Drawing objects cannot be used in RadarScreen and hence we need a way of creating ‘synthetic’ RadarScreen trend lines. Obviously we do not need to display the trend lines on RadarScreen, however we do need to know the values at any specific bar in order to determine whether a crossover has occurred.
The tutorial demonstrates some of the following techniques:
- Tutorial 60 used drawing objects to both show the trend lines visually, but also to allow us to find what their value is at any specific bar. Since drawing objects do not work in Radarscreen, this tutorial shows another way of calculating these same values.
- How to programmatically determine whether an indicator is currently applied to a chart or Radarscreen.
- Issues pertaining to the ‘load addition bars’ functionality found in Radarscreen.
- Discussion of alerts, in particular the ‘alert enabled,’ ‘alert triggered,’ and ”past triggered alert.’
- Active sorting of Radarscreen columns.
As in tutorial 60, the program checks for pivots, sees if the CCI has not crossed the line that joins the pivots while between the pivots and, if applied to a chart, draws a line, storing the line reference in an array.
We add additional functionality to create an ‘imaginary’ line so the same functionality can be replicated in Radarscreen. For each bar, the program goes through the array to see if the CCI has crossed any of the trend lines or imaginary lines stored in their respective arrays. For top pivots the second pivot must be lower than the first pivot and we are looking for the CCI to cross from below to above the line. For bottom pivots we are looking for the second pivot to be greater than the first and the CCI to cross the trend line from above.
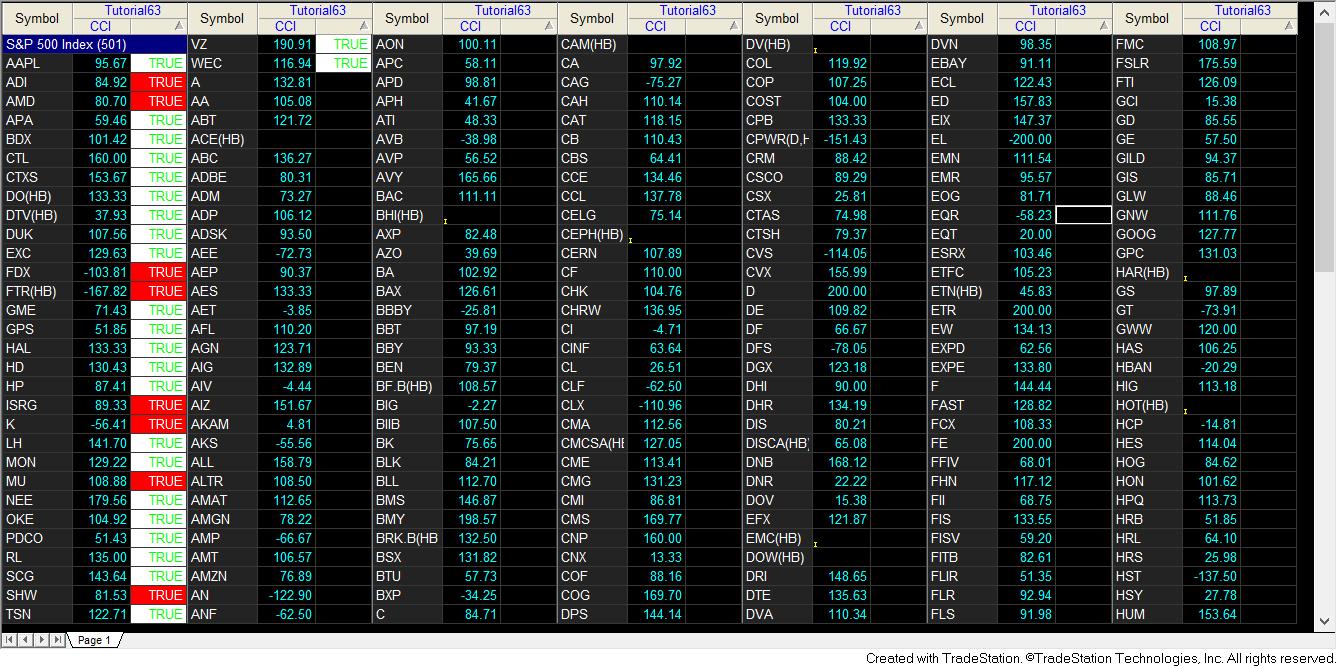
The image below shows the program applied to a Radarscreen containing the Dow Jones Industrial Average (DJIA) stocks. TRUE in green with a white background indicates that CCI has crossed over a CCI trend line from below. TRUE in white on a red background indicates that CCI has crossed under a CCI trend line from above.
In addition to the Radarscreen window I also have an chart window open with the indicator applied. The chart window is linked to the Radarscreen window. Having clicked the BA symbol on the Radarscreen, and doing some minor reformatting of the chart we can see a ‘green’ crossover on the chart, corresponding to the true statement on the Radarscreen.
Three in depth videos, below, explain the tutorial in detail.
The program works in TradeStation versions 8.7, 8.8, 9.0 and 10 and is commented throughout. The program has been tested on intraday, daily, weekly and monthly charts.
TO THE BEST OF MARKPLEX CORPORATION’S KNOWLEDGE, ALL OF THE INFORMATION ON THIS PAGE IS CORRECT, AND IT IS PROVIDED IN THE HOPE THAT IT WILL BE USEFUL. HOWEVER, MARKPLEX CORPORATION ASSUMES NO LIABILITY FOR ANY DAMAGES, DIRECT OR OTHERWISE, RESULTING FROM THE USE OF THIS INFORMATION AND/OR PROGRAM(S) DESCRIBED, AND NO WARRANTY IS MADE REGARDING ITS ACCURACY OR COMPLETENESS. USE OF THIS INFORMATION AND/OR PROGRAMS DESCRIBED IS AT YOUR OWN RISK.
ANY EASYLANGUAGE OR POWERLANGUAGE TRADING STRATEGIES, SIGNALS, STUDIES, INDICATORS, SHOWME STUDIES, PAINTBAR STUDIES, PROBABILITYMAP STUDIES, ACTIVITYBAR STUDIES, FUNCTIONS (AND PARTS THEREOF) AND ASSOCIATED TECHNIQUES REFERRED TO, INCLUDED IN OR ATTACHED TO THIS TUTORIAL OR PROGRAM DESCRIPTION ARE EXAMPLES ONLY, AND HAVE BEEN INCLUDED SOLELY FOR EDUCATIONAL PURPOSES. MARKPLEX CORPORATION. DOES NOT RECOMMEND THAT YOU USE ANY SUCH TRADING STRATEGIES, SIGNALS, STUDIES, INDICATORS, SHOWME STUDIES, PAINTBAR STUDIES, PROBABILITYMAP STUDIES, ACTIVITYBAR STUDIES, FUNCTIONS (OR ANY PARTS THEREOF) OR TECHNIQUES. THE USE OF ANY SUCH TRADING STRATEGIES, SIGNALS, STUDIES, INDICATORS, SHOWME STUDIES, PAINTBAR STUDIES, PROBABILITYMAP STUDIES, ACTIVITYBAR STUDIES, FUNCTIONS AND TECHNIQUES DOES NOT GUARANTEE THAT YOU WILL MAKE PROFITS, INCREASE PROFITS, OR MINIMIZE LOSSES.
Tutorial 63 Part 1 Video – CCI Trend Line Breaks for Radarscreen
Tutorial 63 Part 2 Video – Calculating Crossovers
Tutorial 63 Part 3 Video – Applying CCI Trend Line Breaks Indicator to Radarscreen
The program is commented throughout. The program has been tested on intraday, daily, weekly and monthly charts.
If you see any errors in this tutorial – or we have not made something clear, we would be most grateful if you could please let us know. Also, let us know if you have any ideas for new tutorials.
EasyLanguage is a programming language that is part of the TradeStation trading platform. It can be used to write programs to help in the technical analysis and trading of foreign exchange (forex or FX), commodities (e.g. the Dow e-mini, S&P e-mini etc), options, and stocks.