
TO THE BEST OF MARKPLEX CORPORATION’S KNOWLEDGE, ALL OF THE INFORMATION ON THIS PAGE IS CORRECT, AND IT IS PROVIDED IN THE HOPE THAT IT WILL BE USEFUL. HOWEVER, MARKPLEX CORPORATION ASSUMES NO LIABILITY FOR ANY DAMAGES, DIRECT OR OTHERWISE, RESULTING FROM THE USE OF THIS INFORMATION AND/OR PROGRAM(S) DESCRIBED, AND NO WARRANTY IS MADE REGARDING ITS ACCURACY OR COMPLETENESS. USE OF THIS INFORMATION AND/OR PROGRAMS DESCRIBED IS AT YOUR OWN RISK.
ANY EASYLANGUAGE OR POWERLANGUAGE TRADING STRATEGIES, SIGNALS, STUDIES, INDICATORS, SHOWME STUDIES, PAINTBAR STUDIES, PROBABILITYMAP STUDIES, ACTIVITYBAR STUDIES, FUNCTIONS (AND PARTS THEREOF) AND ASSOCIATED TECHNIQUES REFERRED TO, INCLUDED IN OR ATTACHED TO THIS TUTORIAL OR PROGRAM DESCRIPTION ARE EXAMPLES ONLY, AND HAVE BEEN INCLUDED SOLELY FOR EDUCATIONAL PURPOSES. MARKPLEX CORPORATION. DOES NOT RECOMMEND THAT YOU USE ANY SUCH TRADING STRATEGIES, SIGNALS, STUDIES, INDICATORS, SHOWME STUDIES, PAINTBAR STUDIES, PROBABILITYMAP STUDIES, ACTIVITYBAR STUDIES, FUNCTIONS (OR ANY PARTS THEREOF) OR TECHNIQUES. THE USE OF ANY SUCH TRADING STRATEGIES, SIGNALS, STUDIES, INDICATORS, SHOWME STUDIES, PAINTBAR STUDIES, PROBABILITYMAP STUDIES, ACTIVITYBAR STUDIES, FUNCTIONS AND TECHNIQUES DOES NOT GUARANTEE THAT YOU WILL MAKE PROFITS, INCREASE PROFITS, OR MINIMIZE LOSSES.
In tutorial 6, we took the CCI indicator and used it to demonstrate how to ascertain when a pivot has occurred on the CCI plot and how to add text to a price chart. Specifically, we will look to find ‘pivots’ in the CCI that occur on, or near, the zero line.
This tutorial introduces the subject of arrays. An array is a variable that can store more than one value. For example, say we wanted to store 3 values. We have the option of creating three variables, say v1, v2, and v3. We could then set the values as follows:
v1 = 5,
v2 = 6,
v3 = 9
An alternative would be to create an array: MyArray. We would then set the values as follows:
MyArray[1] = 5,
MyArray[2] = 6,
MyArray[3] = 9
Notice that with the array we have distinguished between the different numbers by using a reference number that appears in the square brackets.
You may wonder what the advantage of arrays is, if, as an alternative we can use simple variables like v1,v2, v3 etc. The answer is that in this trivial example, using an array does not provide a lot of help – however if we had to set the value of a 100 or a 1000 variables, arrays come into their own – particularly when they are assigned values as part of a loop. For example, say for some reason we needed to set a bunch of variables to be equal to the last 100 closing prices. Using variables this would look something like:
Var: v1(0),v2(0),v3(0),v4(0)…etc
v1 = C[1];
v2 = c[2];
v3 = c[3];
v4 = c[4];
.
.
v100 = c[100];
This is long winded and takes a lot of typing. You can probably imagine that it would take even more typing if you needed to read back the variables into a program.
With arrays the process is far simpler. We would set up a loop to read the values into an array, as follows:
Var: Counter(0);
Array: MyArray[100](0);
For Counter = 1 to 100
begin
MyArray[counter] = C[counter];
End;
If you try this, be aware that it will run on every bar – so for a chart with a lot of bars, the processing overhead will be large.
By way of practical example, I have included an exercise to draw trendlines on a chart
 .
.
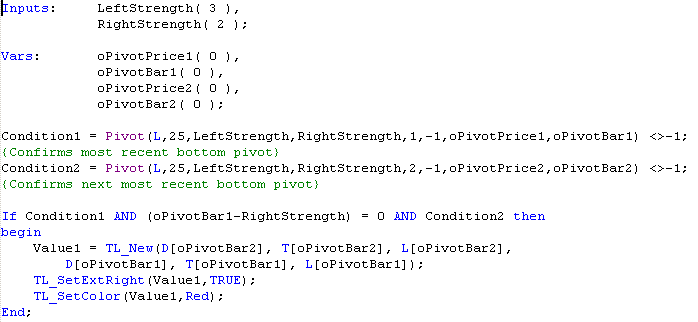
For each bar, the above code sets Condition1 to be TRUE if there has been a bottom pivot within the last 25 bars. Condition2 is set to be true if there has been a pivot prior to the pivot indicated by Condition1 within the last 25 bars. The If..then statement then checks, for each bar whether condition1 (i.e. recent pivot), condition2 (second most recent pivot) and whether oPivotBar1 – RightStrength = 0 are all TRUE. oPivotBar1 – RightStrength checks to see whether condition1 occurred ‘Rightstrength’ bars before the present bar. If these conditions are TRUE, the program will draw a trend line between the first and second pivots. The results will be something like the following:
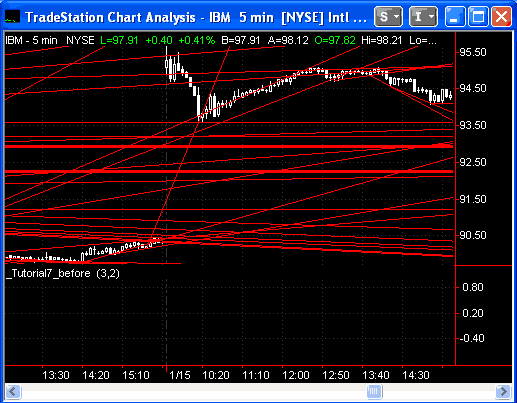
In other words, a lot of lines. Not only is this confusing but there is also a limit on the number of lines that can appear on any given chart. One way of getting around this problem is to rewrite the program so that it only prints the last 10 trendlines. This is an ideal task for an array, but to demonstrate the result of NOT using an array, review the following:
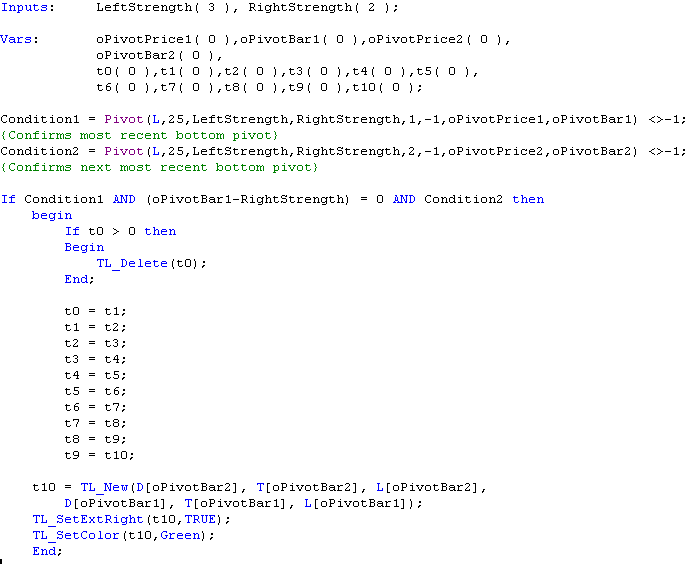
This program works pretty much like the first, however in this case, every time we have a new trendline, we delete the oldest (TL_Delete(t0)) and then cascade all the trendlines IDs,
t0 = t1;
t1 = t2;
t2 = t3;
t3 = t4;
t4 = t5;
t5 = t6;
t6 = t7;
t7 = t8;
t8 = t9;
t9 = t10;
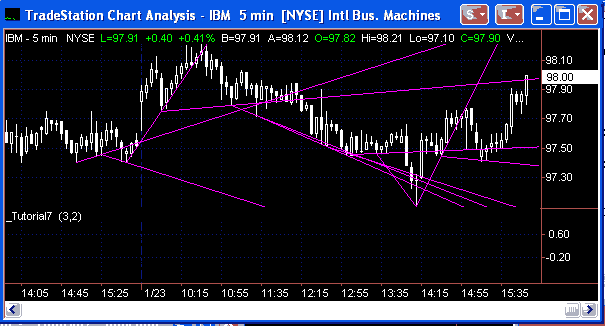
before adding the new trend line: t10 = TL_New(D[oPivotBar2], T[oPivotBar2], L[oPivotBar2],D[oPivotBar1], T[oPivotBar1], L[oPivotBar1]); The result is as follows:
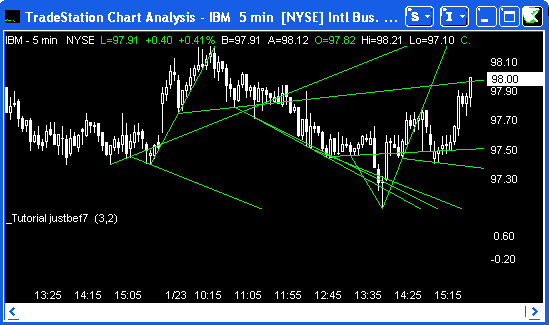
This works well – but what if we wanted plot the last 100 trend lines or 1000? A better way to achieve the same result is to use an array:
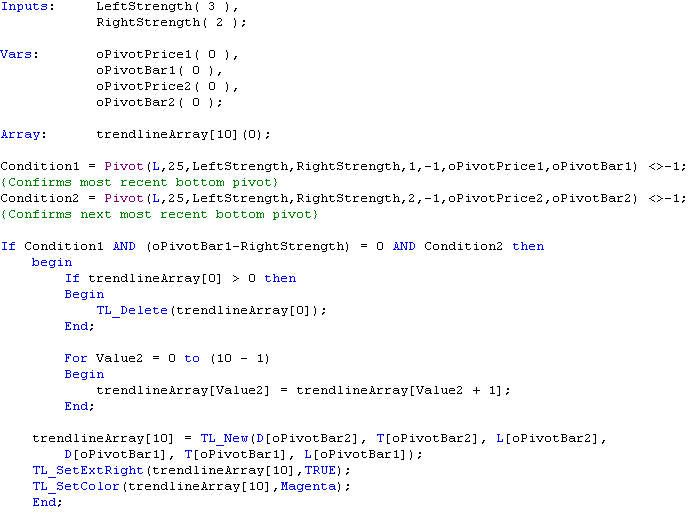
The program is basically the same, except that, this time, instead of having to declare 10 variables, we declare the array:Array: trendlineArray[10](0); and instead of cascading the values as we did previously, we can now write a compact array loop as follows:
For Value2 = 0 to (10 – 1)
Begin
trendlineArray[Value2] = trendlineArray[Value2 + 1];
End;
Again, it may not make too much difference when dealing with 10 variables, but it certainly would if you had a 1000!:
The result of this new program is:
Summary
This tutorial demonstrates the simple use of an array and some of the benefits it gives the EasyLanguage programmer over non-array variables.