

A Gold Pass member suggested that I create a tutorial that demonstrates how to draw three parallel horizontal lines on a chart. The spacing between the upper line and the middle line and between the lower line and the middle line to be determined by user inputs. The lines would move as a group by selecting and dragging the middle line. As the middle line is moved the upper and lower lines maintain their distance from it. See the following short video:
The original version of this program was designed for TradeStation 9.0 and below and for MultiCharts. The program no longer functions correctly with TradeStation 9.5 and up, so this new version uses more up to date technologies to achieve, essentially, the same thing.
The original version used syntax such as:
and
Whereas the new tutorial uses the new drawing objects that became available when TradeStation introduced its object oriented extensions to EasyLanguage.
The following image shows one of the programs included in a downloadable ELD applied to three charts.
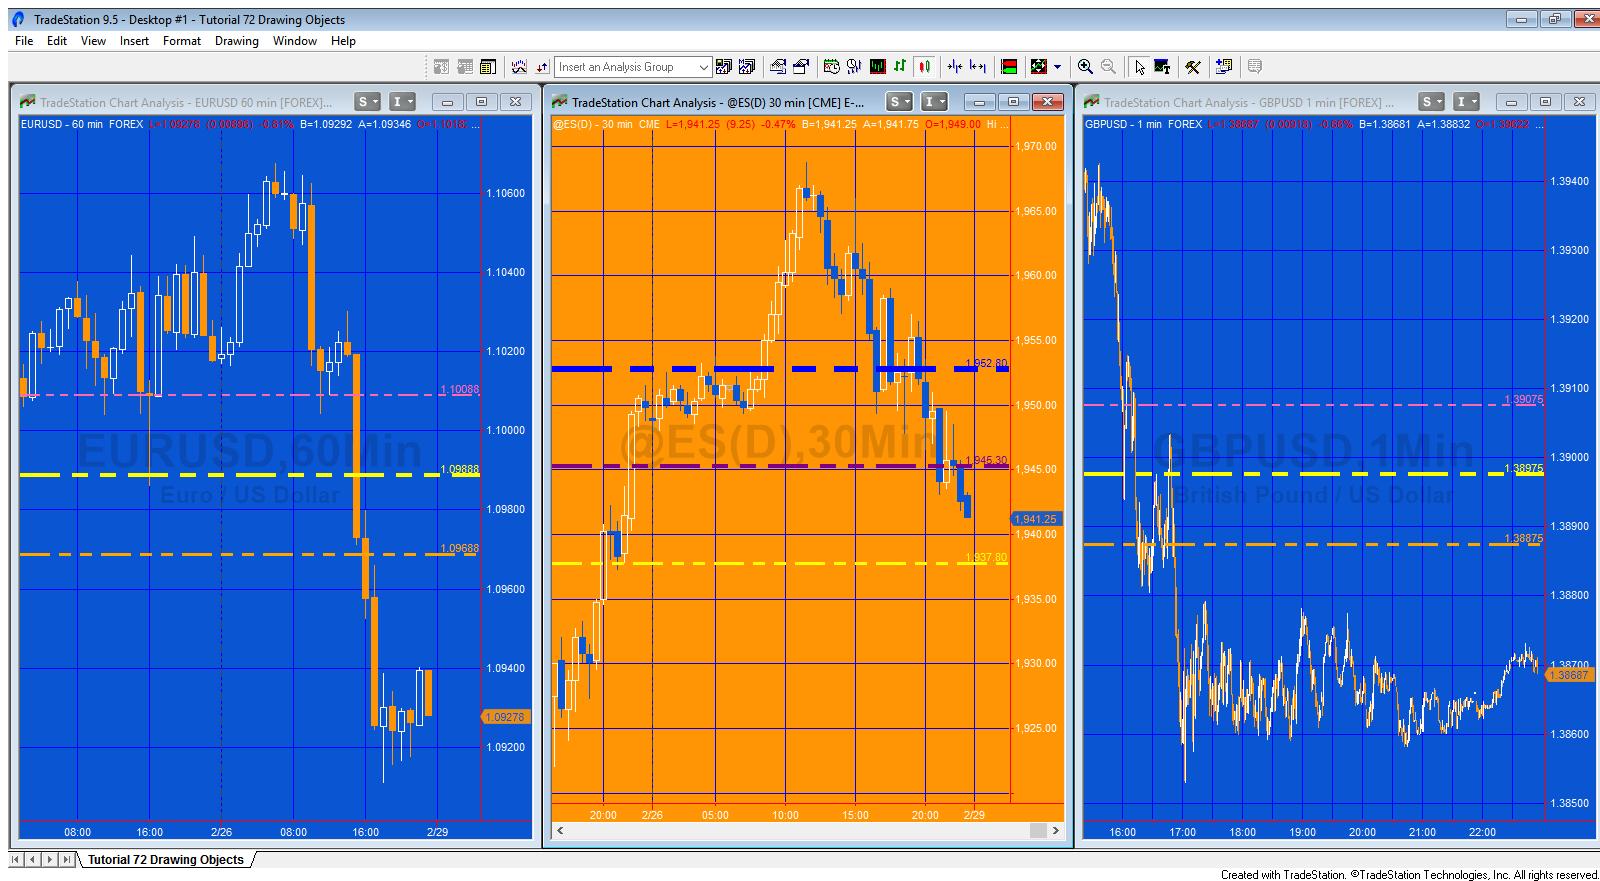
In many respects, by using the new drawing objects, including the HorizontalLine Class, is actually simpler that the way used in the ‘legacy version’ of the program. For example, the HorizontalLine Class creates the horizontal line AND text showing its level. This means that we don’t need to add extra functionality such that when the lines move the text also moves AND the text string changes. Other benefits of using this class include:
- Ease of changing line colors with a vast range of colors (see below)
- Flexibility and ease in making the lines are solid or various types of dotted/dashed
- Line transparency
- The inclusion of an alert object to provide additional properties to enable and configure alert criteria for the horizontal line with many flexible options
I have bundled two programs together. The programs were developed for TradeStation 9.5. They may be downloaded for $19.95:
Alternatively you are welcome to follow the video and retype the code.
In this tutorial I create two programs as follows:
Tutorial 72 first program (_Tutorial72 New Drawing Objects Number 1)
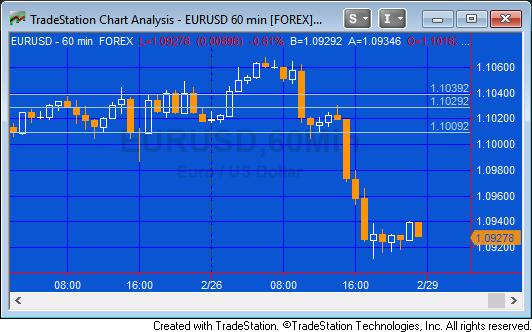
The tutorial program, _Tutorial72 New Drawing Objects Number 1, draws the lines and includes a ChartingHost object such that if the chart is clicked and the mouse button released the price of the middle line is queried and the price levels of the top and bottom lines are recalculated. The top and bottom lines are moved to their new levels.
The lines are drawn with the default color, weight and style.
Inputs
AboveMiddle( 100 ), // Multiple of MinMove / PriceScale above the mid line
BelowMiddle( 200 ), // Multiple of MinMove / PriceScale below the mid line
origVal( GetAppInfo( aiLowestDispValue ) + 0.5 * ( GetAppInfo( aiHighestDispValue ) – GetAppInfo( aiLowestDispValue ) ) ); // Calculates the middle price valus visible on the screen
Tutorial 72 second program (_Tutorial72 New Drawing Objects Number 2)

The second program, _Tutorial72 New Drawing Objects Number 2, is based on the first program, however it provides inputs to also change the line colors, style, and weight.
The font size is changed by double clicking the line. A dialog appears saying: “This drawing object was added by an analysis technique. Do you want to format the analysis technique.” Select NO and then click the labels tab and make adjustments to the typeface. Finally click the ‘default’selection and press the OK button.
Inputs
AboveMiddle( 100 ), // Multiple of MinMove / PriceScale above the mid line
BelowMiddle( 200 ), // Multiple of MinMove / PriceScale below the mid line
origVal( GetAppInfo( aiLowestDispValue ) + 0.5 * ( GetAppInfo( aiHighestDispValue ) – GetAppInfo( aiLowestDispValue ) ) ), // Calculates the middle price valus visible on the screen
TopLineColor( “HotPink” ),
MidLineColor( “Yellow” ),
BottomLineColor( “Orange” ),
TopLineWt( 1 ),
MidLineWt( 3 ),
BottomLineWt( 2 ),
TopLineStyle( 4 ),
MidLineStyle( 5 ),
BottomLineStyle( 5 );
Tutorial 72 | Draw horizontal lines (updated version) video 1
Make sure you set the persist attributes of the top line and the bottom lines correctly:
_Top.Persist = TRUE;
DrawingObjects.Add( _Top );_Bottom = HorizontalLine.Create( BottomVal );
_Bottom.Persist = TRUE;
DrawingObjects.Add( _Bottom );
Tutorial 72 | Draw horizontal lines (updated version) video 2
I have bundled two programs together. The programs were developed for TradeStation 9.5. They may be downloaded for $19.95:
Available colors
| AliceBlue | DarkSlateGray | LightSalmon | PaleVioletRed |
| AntiqueWhite | DarkTurquoise | LightSeaGreen | PapayaWhip |
| Aqua | DarkViolet | LightSkyBlue | PeachPuff |
| Aquamarine | DeepPink | LightSlateGray | Peru |
| Azure | DeepSkyBlue | LightSteelBlue | Pink |
| Beige | DimGray | LightYellow | Plum |
| Bisque | DodgerBlue | Lime | PowderBlue |
| Black | Firebrick | LimeGreen | Purple |
| BlanchedAlmond | FloralWhite | Linen | Red |
| Blue | ForestGreen | Magenta | RosyBrown |
| BlueViolet | Fuschia | Maroon | RoyalBlue |
| Brown | Gainsboro | MediumAquamarine | SaddleBrown |
| Burlywood | GhostWhite | MediumBlue | Salmon |
| CadetBlue | Gold | MediumOrchid | SandyBrown |
| Chartreuse | Goldenrod | MediumPurple | SeaGreen |
| Chocolate | Gray | MediumSeaGreen | Seashell |
| Coral | Green | MediumSlateBlue | Sienna |
| CornflowerBlue | GreenYellow | MediumSpringGreen | Silver |
| Cornsilk | Honeydew | MediumTurquoise | SkyBlue |
| Cyan | HotPink | MediumVioletRed | SlateBlue |
| DarkBlue | IndianRed | MidnightBlue | SlateGray |
| DarkBrown | Indigo | MintCream | Snow |
| DarkCyan | Ivory | MistyRose | SpringGreen |
| DarkGoldenrod | Khaki | Moccasin | SteelBlue |
| DarkGray | Lavender | NavajoWhite | Tan |
| DarkGreen | LavenderBlush | Navy | Teal |
| DarkKhaki | LawnGreen | OldLace | Thistle |
| Dark Magenta | LemonChiffon | Olive | Tomato |
| DarkOliveGreen | LightBlue | OliveDrab | Turquoise |
| DarkOrange | LightCoral | Orange | Violet |
| DarkOrchid | LightCyan | OrangeRed | Wheat |
| DarkRed | LightGoldenrodYellow | Orchid | White |
| DarkSalmon | LightGray | PaleGoldenrod | WhiteSmoke |
| DarkSeaGreen | LightGreen | PaleGreen | Yellow |
| DarkSlateBlue | LightPink | PaleTurquoise | YellowGreen |
TO THE BEST OF MARKPLEX CORPORATION’S KNOWLEDGE, ALL OF THE INFORMATION ON THIS PAGE IS CORRECT, AND IT IS PROVIDED IN THE HOPE THAT IT WILL BE USEFUL. HOWEVER, MARKPLEX CORPORATION ASSUMES NO LIABILITY FOR ANY DAMAGES, DIRECT OR OTHERWISE, RESULTING FROM THE USE OF THIS INFORMATION AND/OR PROGRAM(S) DESCRIBED, AND NO WARRANTY IS MADE REGARDING ITS ACCURACY OR COMPLETENESS. USE OF THIS INFORMATION AND/OR PROGRAMS DESCRIBED IS AT YOUR OWN RISK.
ANY EASYLANGUAGE OR POWERLANGUAGE TRADING STRATEGIES, SIGNALS, STUDIES, INDICATORS, SHOWME STUDIES, PAINTBAR STUDIES, PROBABILITYMAP STUDIES, ACTIVITYBAR STUDIES, FUNCTIONS (AND PARTS THEREOF) AND ASSOCIATED TECHNIQUES REFERRED TO, INCLUDED IN OR ATTACHED TO THIS TUTORIAL OR PROGRAM DESCRIPTION ARE EXAMPLES ONLY, AND HAVE BEEN INCLUDED SOLELY FOR EDUCATIONAL PURPOSES. MARKPLEX CORPORATION. DOES NOT RECOMMEND THAT YOU USE ANY SUCH TRADING STRATEGIES, SIGNALS, STUDIES, INDICATORS, SHOWME STUDIES, PAINTBAR STUDIES, PROBABILITYMAP STUDIES, ACTIVITYBAR STUDIES, FUNCTIONS (OR ANY PARTS THEREOF) OR TECHNIQUES. THE USE OF ANY SUCH TRADING STRATEGIES, SIGNALS, STUDIES, INDICATORS, SHOWME STUDIES, PAINTBAR STUDIES, PROBABILITYMAP STUDIES, ACTIVITYBAR STUDIES, FUNCTIONS AND TECHNIQUES DOES NOT GUARANTEE THAT YOU WILL MAKE PROFITS, INCREASE PROFITS, OR MINIMIZE LOSSES.