Tutorial 72 | Drawing and moving three horizontal lines (uses legacy drawing tools)
The downloaded versions have been modified to work with the latest versions of TradeStation. In the original versions the date and time inputs for some of the drawing function used zero. These have been replaced by variables that stores the first date and time on the chart (after maxbarsback). For example,
_Top = TL_New( 0, 0, TopVal, CurrentDate, CurrentTime, TopVal );
was replaced with:
_Top = TL_New( FirstDate, FirstTime, TopVal, CurrentDate, CurrentTime, TopVal );
FirstDate and FirstTime are set in the variable declarations as follows:
double FirstDate( D ), // Stores first date after maxbarsback
double FirstTime( T ); // Stores first time after maxbarsback
The videos do not reflect these changes.
These programs were designed for all versions of TradeStation. Tutorial 72 and Tutorial 72b also work with Multicharts.
A Gold Pass member suggested that I create a tutorial that demonstrates how to draw three parallel horizontal lines on a chart. The spacing between the upper line and the middle line and between the lower line and the middle line to be determined by user inputs. The lines would move as a group by selecting and dragging the middle line. As the middle line is moved the upper and lower lines maintain their distance from it.
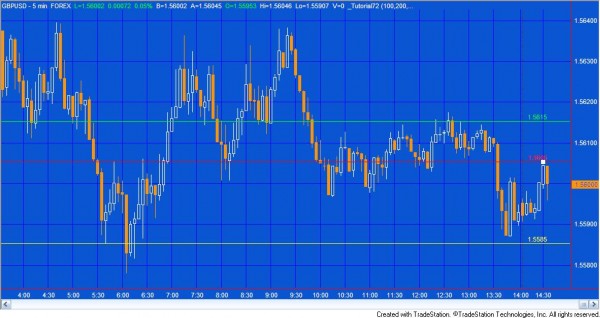
The following image shows one of the programs included in a downloadable ELD applied to a GBPUSD 5 minute chart.
 The values of the lines are displayed just above the lines (in this case, to four decimal places). If the middle (or red line) is dragged into a new position, then the upper and lower lines also move.
The four programs are bundled together (the two programs created in the first video and the second video–plus programs modified slightly to position the text above the lines and to modify the colors of the lines and the text. They may be downloaded for $39.95:
In the following video I demonstrate a simple implementation of this idea. One potential problem with this implementation is that we have to wait for a tick before the program runs and the lines and text are relocated. In a second video (available to Gold pass members) I show how to use the TradeStation Timer and a method to increase the speed at which the lines and text are moved.
Tutorial 72 | Part 1
The four programs are bundled together (the two programs created in the first video and the second video–plus programs modified slightly to position the text above the lines and to modify the colors. They may be downloaded for $39.95:
The following video is available to Gold Pass members:
Tutorial 72 | Part 2 | Using the TradeStation Timer and methods
![]() This content is for members only.
This content is for members only.
TO THE BEST OF MARKPLEX CORPORATION’S KNOWLEDGE, ALL OF THE INFORMATION ON THIS PAGE IS CORRECT, AND IT IS PROVIDED IN THE HOPE THAT IT WILL BE USEFUL. HOWEVER, MARKPLEX CORPORATION ASSUMES NO LIABILITY FOR ANY DAMAGES, DIRECT OR OTHERWISE, RESULTING FROM THE USE OF THIS INFORMATION AND/OR PROGRAM(S) DESCRIBED, AND NO WARRANTY IS MADE REGARDING ITS ACCURACY OR COMPLETENESS. USE OF THIS INFORMATION AND/OR PROGRAMS DESCRIBED IS AT YOUR OWN RISK.
ANY EASYLANGUAGE OR POWERLANGUAGE TRADING STRATEGIES, SIGNALS, STUDIES, INDICATORS, SHOWME STUDIES, PAINTBAR STUDIES, PROBABILITYMAP STUDIES, ACTIVITYBAR STUDIES, FUNCTIONS (AND PARTS THEREOF) AND ASSOCIATED TECHNIQUES REFERRED TO, INCLUDED IN OR ATTACHED TO THIS TUTORIAL OR PROGRAM DESCRIPTION ARE EXAMPLES ONLY, AND HAVE BEEN INCLUDED SOLELY FOR EDUCATIONAL PURPOSES. MARKPLEX CORPORATION. DOES NOT RECOMMEND THAT YOU USE ANY SUCH TRADING STRATEGIES, SIGNALS, STUDIES, INDICATORS, SHOWME STUDIES, PAINTBAR STUDIES, PROBABILITYMAP STUDIES, ACTIVITYBAR STUDIES, FUNCTIONS (OR ANY PARTS THEREOF) OR TECHNIQUES. THE USE OF ANY SUCH TRADING STRATEGIES, SIGNALS, STUDIES, INDICATORS, SHOWME STUDIES, PAINTBAR STUDIES, PROBABILITYMAP STUDIES, ACTIVITYBAR STUDIES, FUNCTIONS AND TECHNIQUES DOES NOT GUARANTEE THAT YOU WILL MAKE PROFITS, INCREASE PROFITS, OR MINIMIZE LOSSES.

