


I was asked by a Gold Pass member to create a simple tutorial of how to find the highest and lowest prices between two specified times. I covered similar material before in tutorial 68, but I have simplified it even further in this new tutorial.
The program (a TradeStation EasyLanguage indicator) allows the user to input a start and end time. It then calculates the highest and lowest price values between (and including) these times. It then plots these values.
The following video demonstrates the tutorial 73:
Video – Finding the highest and lowest values between two times
Copy and paste this program
If you are a Gold Pass member you can copy and paste the program below for free:
Program download
The UNPROTECTED indicator (i.e. the TradeStation EasyLanguage is fully functional, commented and you can see the source code) is available for for IMMEDIATE download for $19.95- by clicking the ‘add to cart’ button.
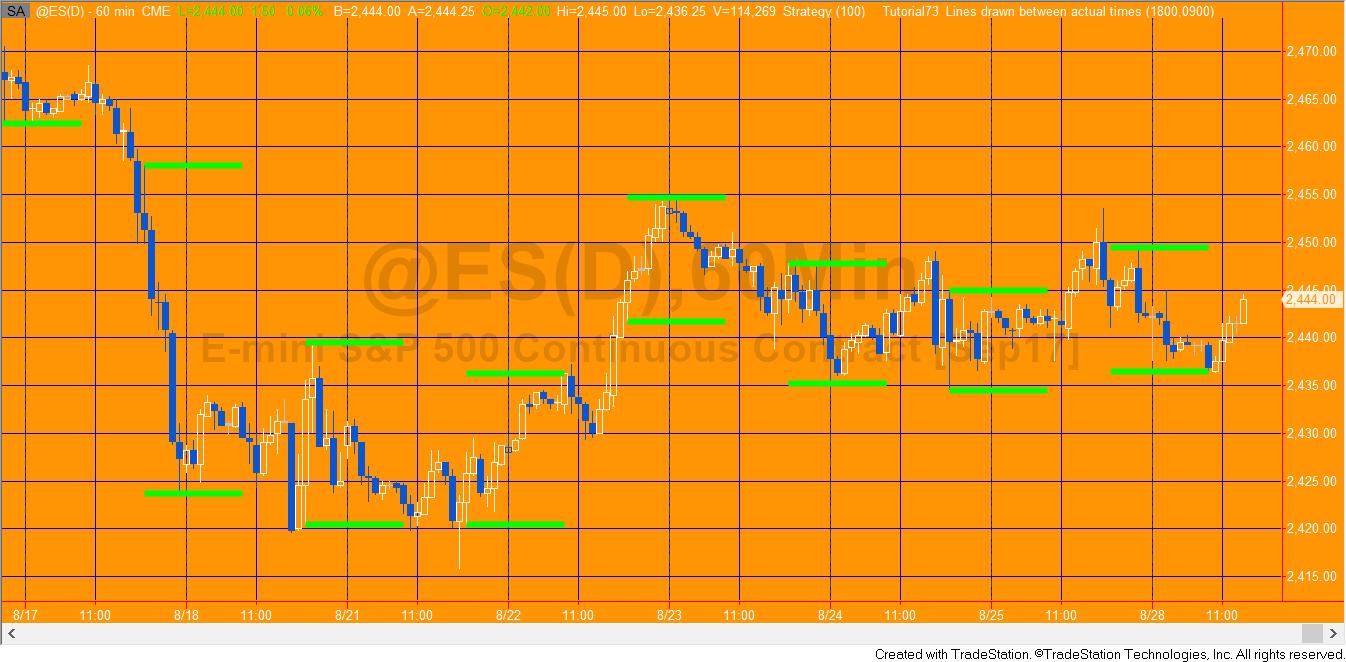
The download includes two bonus programs. In the first bonus program the code has been modified to allow the start time to be on the day before. The second bonus video draws lines between the start and end times (rather than plotting them). This program is meant for minute charts (rather than tick or seconds charts).
After download the program can be opened, you will be able to see the program code and modify it. After purchase you will be redirected to a download page, so don’t close the browser.
The programs work in MultiCharts.
Questions and answers
Is it possible to just plot the LastPeriodHigh and LastPeriodLow between the StartTime and EndTime?
Yes it is possible. First of all remember that the LastPeriodHigh and LastPeriodLow refer to the previous period.
To achieve this you need to made two small changes.
Change the plot statements to:
If T >= StartTime and T <= EndTime then
Begin
	Plot1( LastPeriodHigh );
	Plot2( LastPeriodLow );
End;
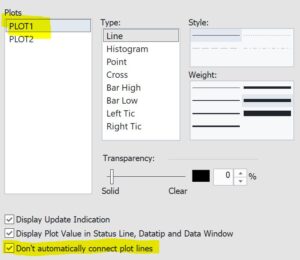
and, for each plot go to the indicator Style page (In TradeStation 10: Studies – Edit Studies select _Tutorial73 and click Customize. Select the Style tab) then for Plot1 and Plot2 make sure that “Don’t automatically connect plot lines” is selected (highlighted in yellow the following image).

Question: How could I modify the program so that it plots a ‘show me’ dot immediately after the period being analyzed is finished?
Answer: To just plot one at the beginning of the period, comment out the plot statement above, e.g
// Plot1( LastPeriodHigh );
// Plot2( LastPeriodLow );
Go into Studies-Edit Studies, double click om this indicator. Click on ‘style’ and select ‘point’, then modify the plot statement as follows:
If T > EndTime and T[1] <= EndTime Then
Begin
// Plot LastPeriodHigh and LastPeriodLow
Plot1( LastPeriodHigh );
Plot2( LastPeriodLow );
End;

TO THE BEST OF MARKPLEX CORPORATION’S KNOWLEDGE, ALL OF THE INFORMATION ON THIS PAGE IS CORRECT, AND IT IS PROVIDED IN THE HOPE THAT IT WILL BE USEFUL. HOWEVER, MARKPLEX CORPORATION ASSUMES NO LIABILITY FOR ANY DAMAGES, DIRECT OR OTHERWISE, RESULTING FROM THE USE OF THIS INFORMATION AND/OR PROGRAM(S) DESCRIBED, AND NO WARRANTY IS MADE REGARDING ITS ACCURACY OR COMPLETENESS. USE OF THIS INFORMATION AND/OR PROGRAMS DESCRIBED IS AT YOUR OWN RISK.
ANY EASYLANGUAGE OR POWERLANGUAGE TRADING STRATEGIES, SIGNALS, STUDIES, INDICATORS, SHOWME STUDIES, PAINTBAR STUDIES, PROBABILITYMAP STUDIES, ACTIVITYBAR STUDIES, FUNCTIONS (AND PARTS THEREOF) AND ASSOCIATED TECHNIQUES REFERRED TO, INCLUDED IN OR ATTACHED TO THIS TUTORIAL OR PROGRAM DESCRIPTION ARE EXAMPLES ONLY, AND HAVE BEEN INCLUDED SOLELY FOR EDUCATIONAL PURPOSES. MARKPLEX CORPORATION. DOES NOT RECOMMEND THAT YOU USE ANY SUCH TRADING STRATEGIES, SIGNALS, STUDIES, INDICATORS, SHOWME STUDIES, PAINTBAR STUDIES, PROBABILITYMAP STUDIES, ACTIVITYBAR STUDIES, FUNCTIONS (OR ANY PARTS THEREOF) OR TECHNIQUES. THE USE OF ANY SUCH TRADING STRATEGIES, SIGNALS, STUDIES, INDICATORS, SHOWME STUDIES, PAINTBAR STUDIES, PROBABILITYMAP STUDIES, ACTIVITYBAR STUDIES, FUNCTIONS AND TECHNIQUES DOES NOT GUARANTEE THAT YOU WILL MAKE PROFITS, INCREASE PROFITS, OR MINIMIZE LOSSES.