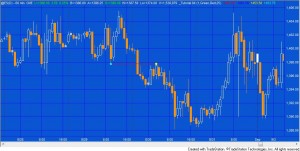
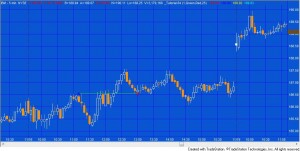
Tutorial 84 demonstrates how to write a simple program that looks for low pivots and, having found one, searches for previous high pivots at the same price level (or close to the previous price level).
The idea behind the program is that the high pivots might have resulted in a level of resistance on the chart that when broken becomes a level of support. Click on the images below to see bigger images.

In the following video I create a simple version of the program that plots show me dots at the low and high pivots. An enhancement draws a line between the pivots. A further enhancement demonstrates how to make some of the values that are hard coded in the program into user inputs as well as showing how to have the program show pivots that are close, but not at exactly the same price level.

If you want to save some typing I am also making a version of this program available for download. This version is similar to the one demonstrated in the video except that as well as looking for a low pivot and previous high pivots at proximate price levels, it also looks for a high pivot and previous low pivots. In addition the program treats the Tolerance input differently. In the downloadable version the Tolerance input represents a multiple of ticks. Also, the right strength of the most recent pivot is set to 2 bars. I have included a list of inputs for the downloadable program lower down the page.
The unprotected EasyLanguage show me study is available for immediate download for $19.95 by clicking the ‘add to cart’ button. You can pay with credit card or PayPal.
As usual, Gold Pass members are entitled to an additional 20% discount off all program and tutorial prices. If you are a Gold Pass member make sure you enter the special coupon code to get 20% discount off this price.
I have also included a bonus video for Gold Pass members that shows how you can ‘color code’ the previous high pivots so you have a visual reference as to which was the most recent, the next most recent and so on.
Video explanation
If you are are a Gold Pass member I have included a bonus video below, make sure you are logged in to see the following content:
The unprotected EasyLanguage show me study is available for immediate download for $19.95 by clicking the ‘add to cart’ button. You can pay with credit card or PayPal.
As usual, Gold Pass members are entitled to additional 20% discount off all program and tutorial prices. If you are a Gold Pass member make sure you enter the special coupon code to get 20% discount off this price.
Inputs for downloadable program
Tolerance( 1 ), // Pivot tolerance expressed as ticks
BullCol( Green ), // Determines color of lines drawn between pivots
BearCol( Red ), // Determines color of lines drawn between pivots
LookBack( 25 ); // How many bars to look back when searching for pivots
THESE INDICATORS, SHOW ME STUDIES, STRATEGIES AND OTHER PROGRAMS HAVE BEEN INCLUDED SOLELY FOR EDUCATIONAL PURPOSES.
TO THE BEST OF MARKPLEX CORPORATION’S KNOWLEDGE, ALL OF THE INFORMATION ON THIS PAGE IS CORRECT, AND IT IS PROVIDED IN THE HOPE THAT IT WILL BE USEFUL. HOWEVER, MARKPLEX CORPORATION ASSUMES NO LIABILITY FOR ANY DAMAGES, DIRECT OR OTHERWISE, RESULTING FROM THE USE OF THIS INFORMATION AND/OR PROGRAM(S) DESCRIBED, AND NO WARRANTY IS MADE REGARDING ITS ACCURACY OR COMPLETENESS. USE OF THIS INFORMATION AND/OR PROGRAMS DESCRIBED IS AT YOUR OWN RISK.
ANY EASYLANGUAGE OR POWERLANGUAGE TRADING STRATEGIES, SIGNALS, STUDIES, INDICATORS, SHOWME STUDIES, PAINTBAR STUDIES, PROBABILITYMAP STUDIES, ACTIVITYBAR STUDIES, FUNCTIONS (AND PARTS THEREOF) AND ASSOCIATED TECHNIQUES REFERRED TO, INCLUDED IN OR ATTACHED TO THIS TUTORIAL OR PROGRAM DESCRIPTION ARE EXAMPLES ONLY, AND HAVE BEEN INCLUDED SOLELY FOR EDUCATIONAL PURPOSES. MARKPLEX CORPORATION. DOES NOT RECOMMEND THAT YOU USE ANY SUCH TRADING STRATEGIES, SIGNALS, STUDIES, INDICATORS, SHOWME STUDIES, PAINTBAR STUDIES, PROBABILITYMAP STUDIES, ACTIVITYBAR STUDIES, FUNCTIONS (OR ANY PARTS THEREOF) OR TECHNIQUES. THE USE OF ANY SUCH TRADING STRATEGIES, SIGNALS, STUDIES, INDICATORS, SHOWME STUDIES, PAINTBAR STUDIES, PROBABILITYMAP STUDIES, ACTIVITYBAR STUDIES, FUNCTIONS AND TECHNIQUES DOES NOT GUARANTEE THAT YOU WILL MAKE PROFITS, INCREASE PROFITS, OR MINIMIZE LOSSES.

