
Volume profile for user defined period
N.B. September 26, 2014: I have released a new version of this program which includes:
- Improved comments
- Automatic detection of whether the chart is set to local or exchange time
- Only loading tick or volume data, depending on user input
Program 57 is available for immediate download for $84.95. The download is a TradeStation ELD file that includes the unprotected and commented program. This program will not work in MultiCharts because it uses the TradeStation collections and other functionality that is not available in the MultiCharts environment.
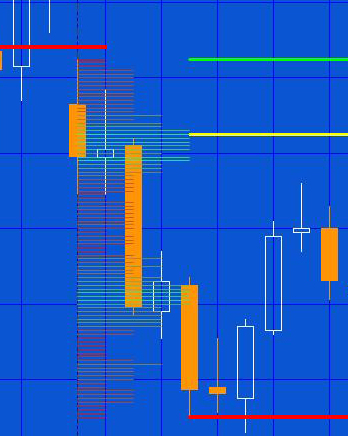
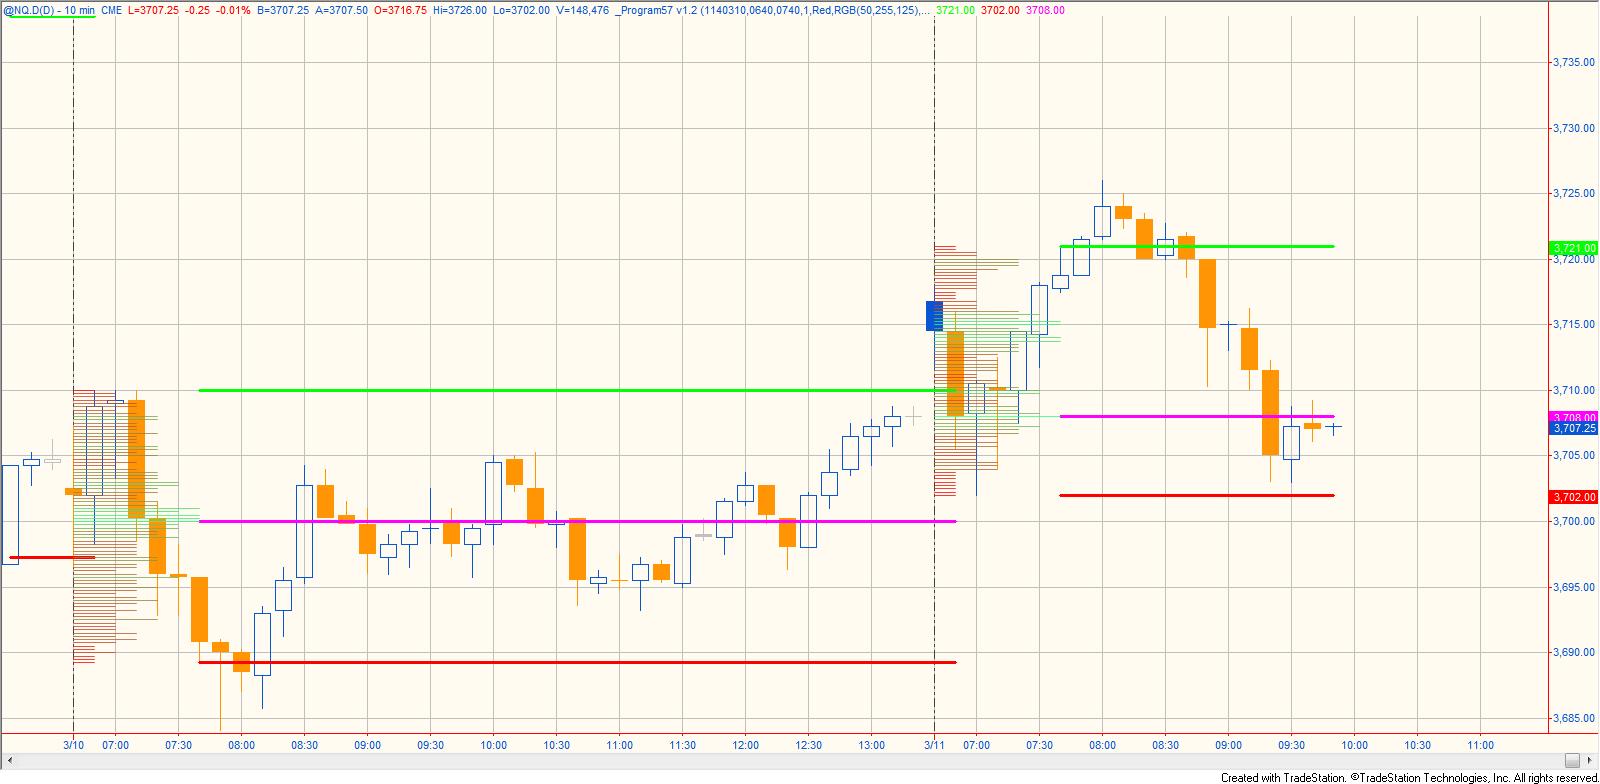
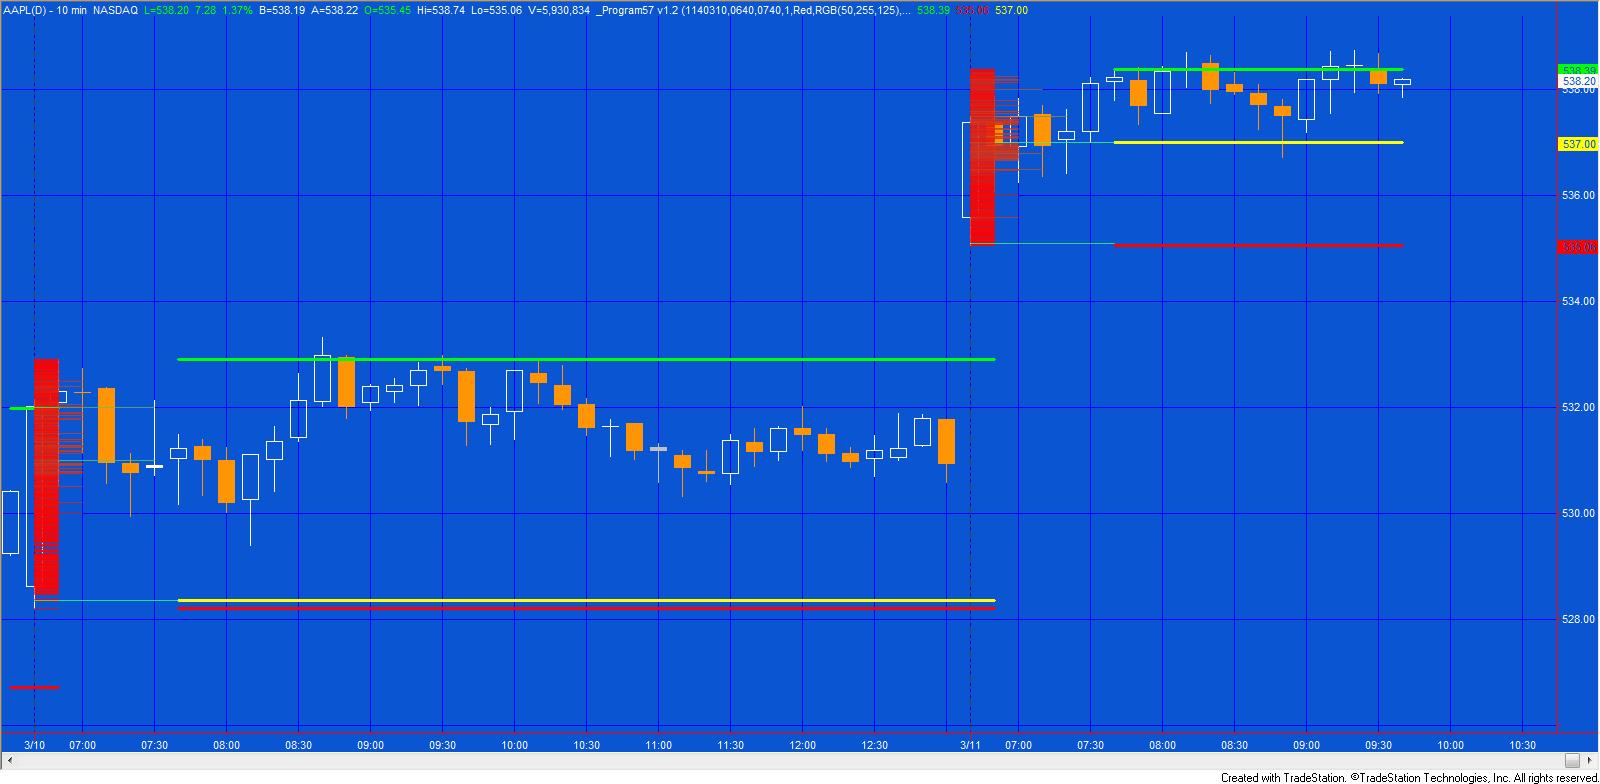
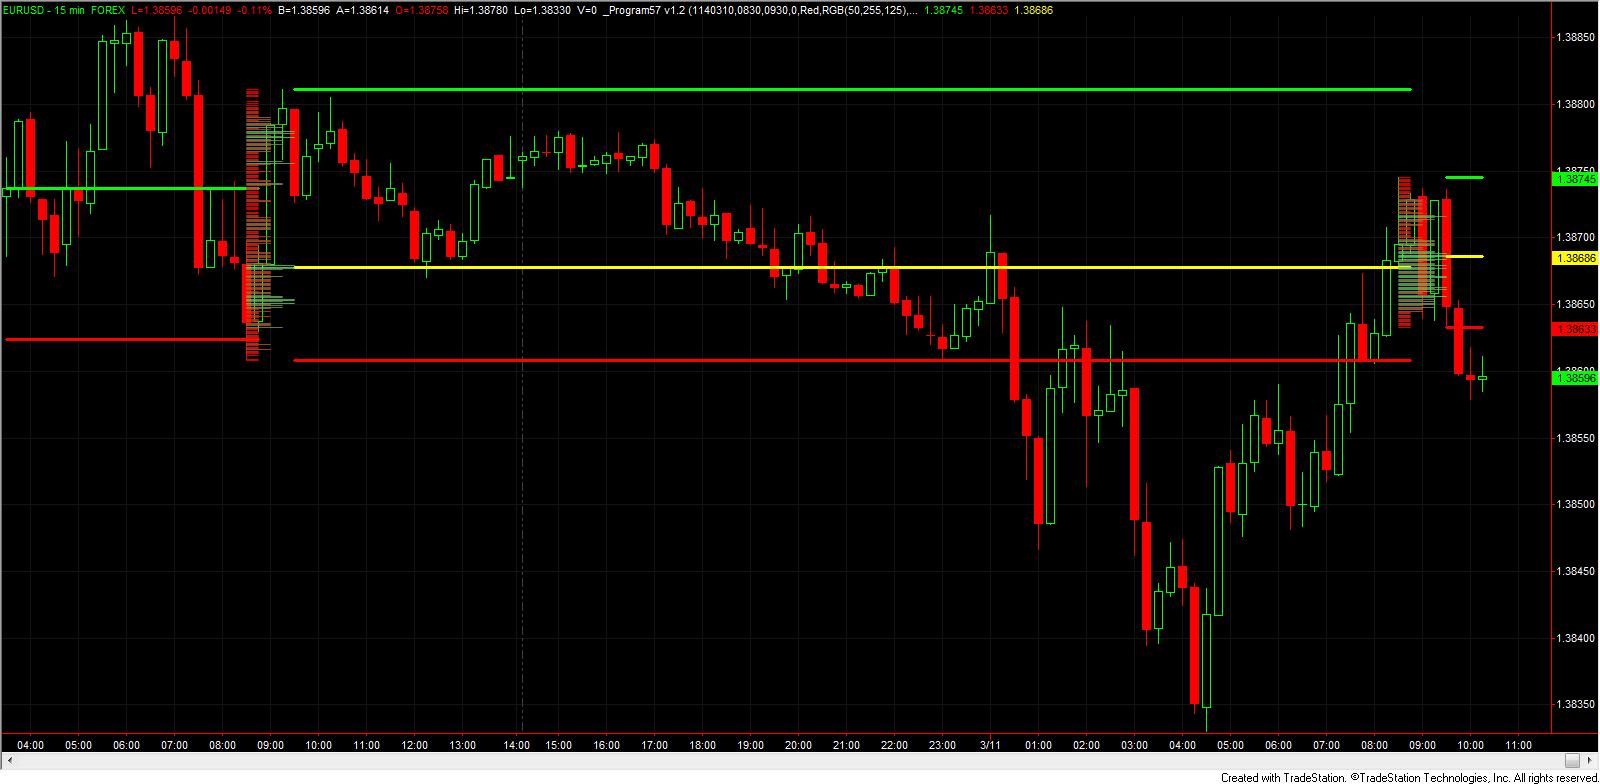
Program 57 uses Price Series Provider to create a volume profile for a specified period in the day. This period could be the first hour of trading, for example. The profile is drawn on the chart in the period being analyzed (see image). The profile is color coded between 2 user specified colors. In the image on the right, the colors are red and green. Because the drawing tool used in this program can only draw to specific bars, the lengths of the profile are an approximation.
Having calculated the volume profile, program 57 then calculates at which price level most volume occurred during the period being analyzed. It then plots 3 horizontal lines at the following levels:
- The price high of the period being analyzed
- The price low of the period being analyzed
- The price at which the highest volume occurred during the period being analyzed
The colors of these horizontal lines are defined by user inputs (see all the user inputs below). Another user input determines whether the program uses ticks or volume.
Because program 57 uses a tick based price series provider (PSP), it is handling a lot of data and doing a lot of processing, consequently a user input determines the date to begin processing. It is best to process as few days as possible.
Program 57 is available for immediate download for $84.95. The download is a TradeStation ELD file that includes the unprotected and commented program. This program will not work in MultiCharts because it uses the TradeStation collections and other functionality that is not available in the MultiCharts environment.
How does program 57 calculate the volume profile?
At the close of the EndTime bar the program looks back through the PSP to find the volume (or tick counts depending on settings) at each price level. At the close of each bar the program stores volume into a dictionary with a key of the closing price of the bar. If a key-value pair already exists in the dictionary for the price, the volume is added to the existing volume for that price. Once all the volume data has been collected and stored, the levels are then copied into vectors to be sorted. The price level with the maximum volume is the pivot. Program 57 uses the local time setting.
Program 56 was designed for TradeStation 9.1 (update 22 and above). It works on intraday minute bars. Program 57 assumes that the StartTime and EndTime are on the same day and that the StartTime is before the EndTime. It also assumes that there are bars with the the StartTime and EndTime.
This program will not work in MultiCharts because it uses the TradeStation collections and other functionality that is not available in the MultiCharts environment.
See the video below for a demonstration of the program.
Technical architecture
Program 57 makes extensive use of dictionaries and vectors. It also uses the new drawing objects functionality.
Program 57 is available for immediate download for $84.95. The download is a TradeStation ELD file that includes the unprotected and commented program. This program will not work in MultiCharts because it uses the TradeStation collections and other functionality that is not available in the MultiCharts environment.
Inputs for program 57
FirstDate( 1140101 ), // The first date that a volume profile is created for
StartTime( 0830 ), // Time of the first bar in the period to be analyzed
EndTime( 0930 ), // Time of the last bar in the period to be analyzed
TicksOrVol( 1 ), // 0 = use ticks, 1 = use volume
HistColor1( Red ), // Color of prices at which the least volume occurred
HistColor2( RGB(50,255,125) ), // Color of the lines at which the moast volume occurred
TopLine( Green ), // Color of line at the high of the period
BottomLine( Red ), // Color of line at the low of the period
VolPivLine( Yellow ); // Color of the line at the price at which most volume occurred
Video of program 57
Frequently Asked Questions
Q. If I buy the program, how do I receive it?
A. After paying for the software you will be automatically forwarded back to Markplex where you will see a download link. You will also receive an email with a download link. If you have any problems email martyn.whittaker@markplex.com.
THESE INDICATORS, SHOW ME STUDIES, STRATEGIES AND OTHER PROGRAMS HAVE BEEN INCLUDED SOLELY FOR EDUCATIONAL PURPOSES.
TO THE BEST OF MARKPLEX CORPORATION’S KNOWLEDGE, ALL OF THE INFORMATION ON THIS PAGE IS CORRECT, AND IT IS PROVIDED IN THE HOPE THAT IT WILL BE USEFUL. HOWEVER, MARKPLEX CORPORATION ASSUMES NO LIABILITY FOR ANY DAMAGES, DIRECT OR OTHERWISE, RESULTING FROM THE USE OF THIS INFORMATION AND/OR PROGRAM(S) DESCRIBED, AND NO WARRANTY IS MADE REGARDING ITS ACCURACY OR COMPLETENESS. USE OF THIS INFORMATION AND/OR PROGRAMS DESCRIBED IS AT YOUR OWN RISK.
ANY EASYLANGUAGE OR POWERLANGUAGE TRADING STRATEGIES, SIGNALS, STUDIES, INDICATORS, SHOWME STUDIES, PAINTBAR STUDIES, PROBABILITYMAP STUDIES, ACTIVITYBAR STUDIES, FUNCTIONS (AND PARTS THEREOF) AND ASSOCIATED TECHNIQUES REFERRED TO, INCLUDED IN OR ATTACHED TO THIS TUTORIAL OR PROGRAM DESCRIPTION ARE EXAMPLES ONLY, AND HAVE BEEN INCLUDED SOLELY FOR EDUCATIONAL PURPOSES. MARKPLEX CORPORATION. DOES NOT RECOMMEND THAT YOU USE ANY SUCH TRADING STRATEGIES, SIGNALS, STUDIES, INDICATORS, SHOWME STUDIES, PAINTBAR STUDIES, PROBABILITYMAP STUDIES, ACTIVITYBAR STUDIES, FUNCTIONS (OR ANY PARTS THEREOF) OR TECHNIQUES. THE USE OF ANY SUCH TRADING STRATEGIES, SIGNALS, STUDIES, INDICATORS, SHOWME STUDIES, PAINTBAR STUDIES, PROBABILITYMAP STUDIES, ACTIVITYBAR STUDIES, FUNCTIONS AND TECHNIQUES DOES NOT GUARANTEE THAT YOU WILL MAKE PROFITS, INCREASE PROFITS, OR MINIMIZE LOSSES.