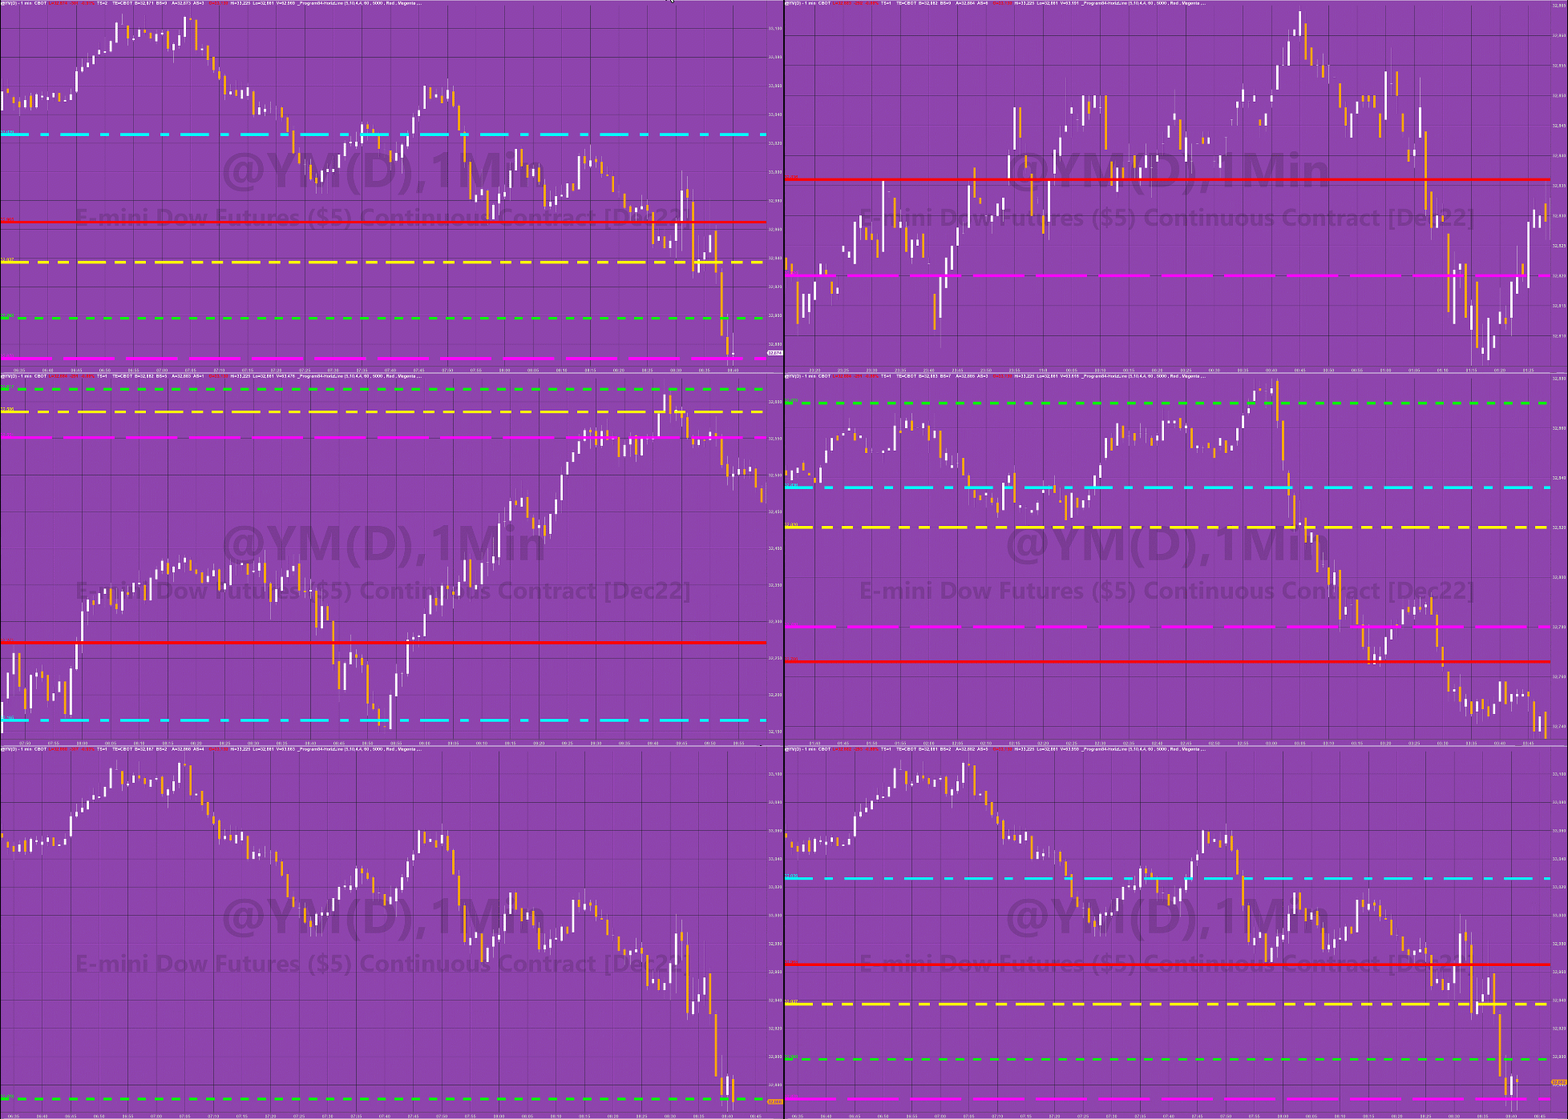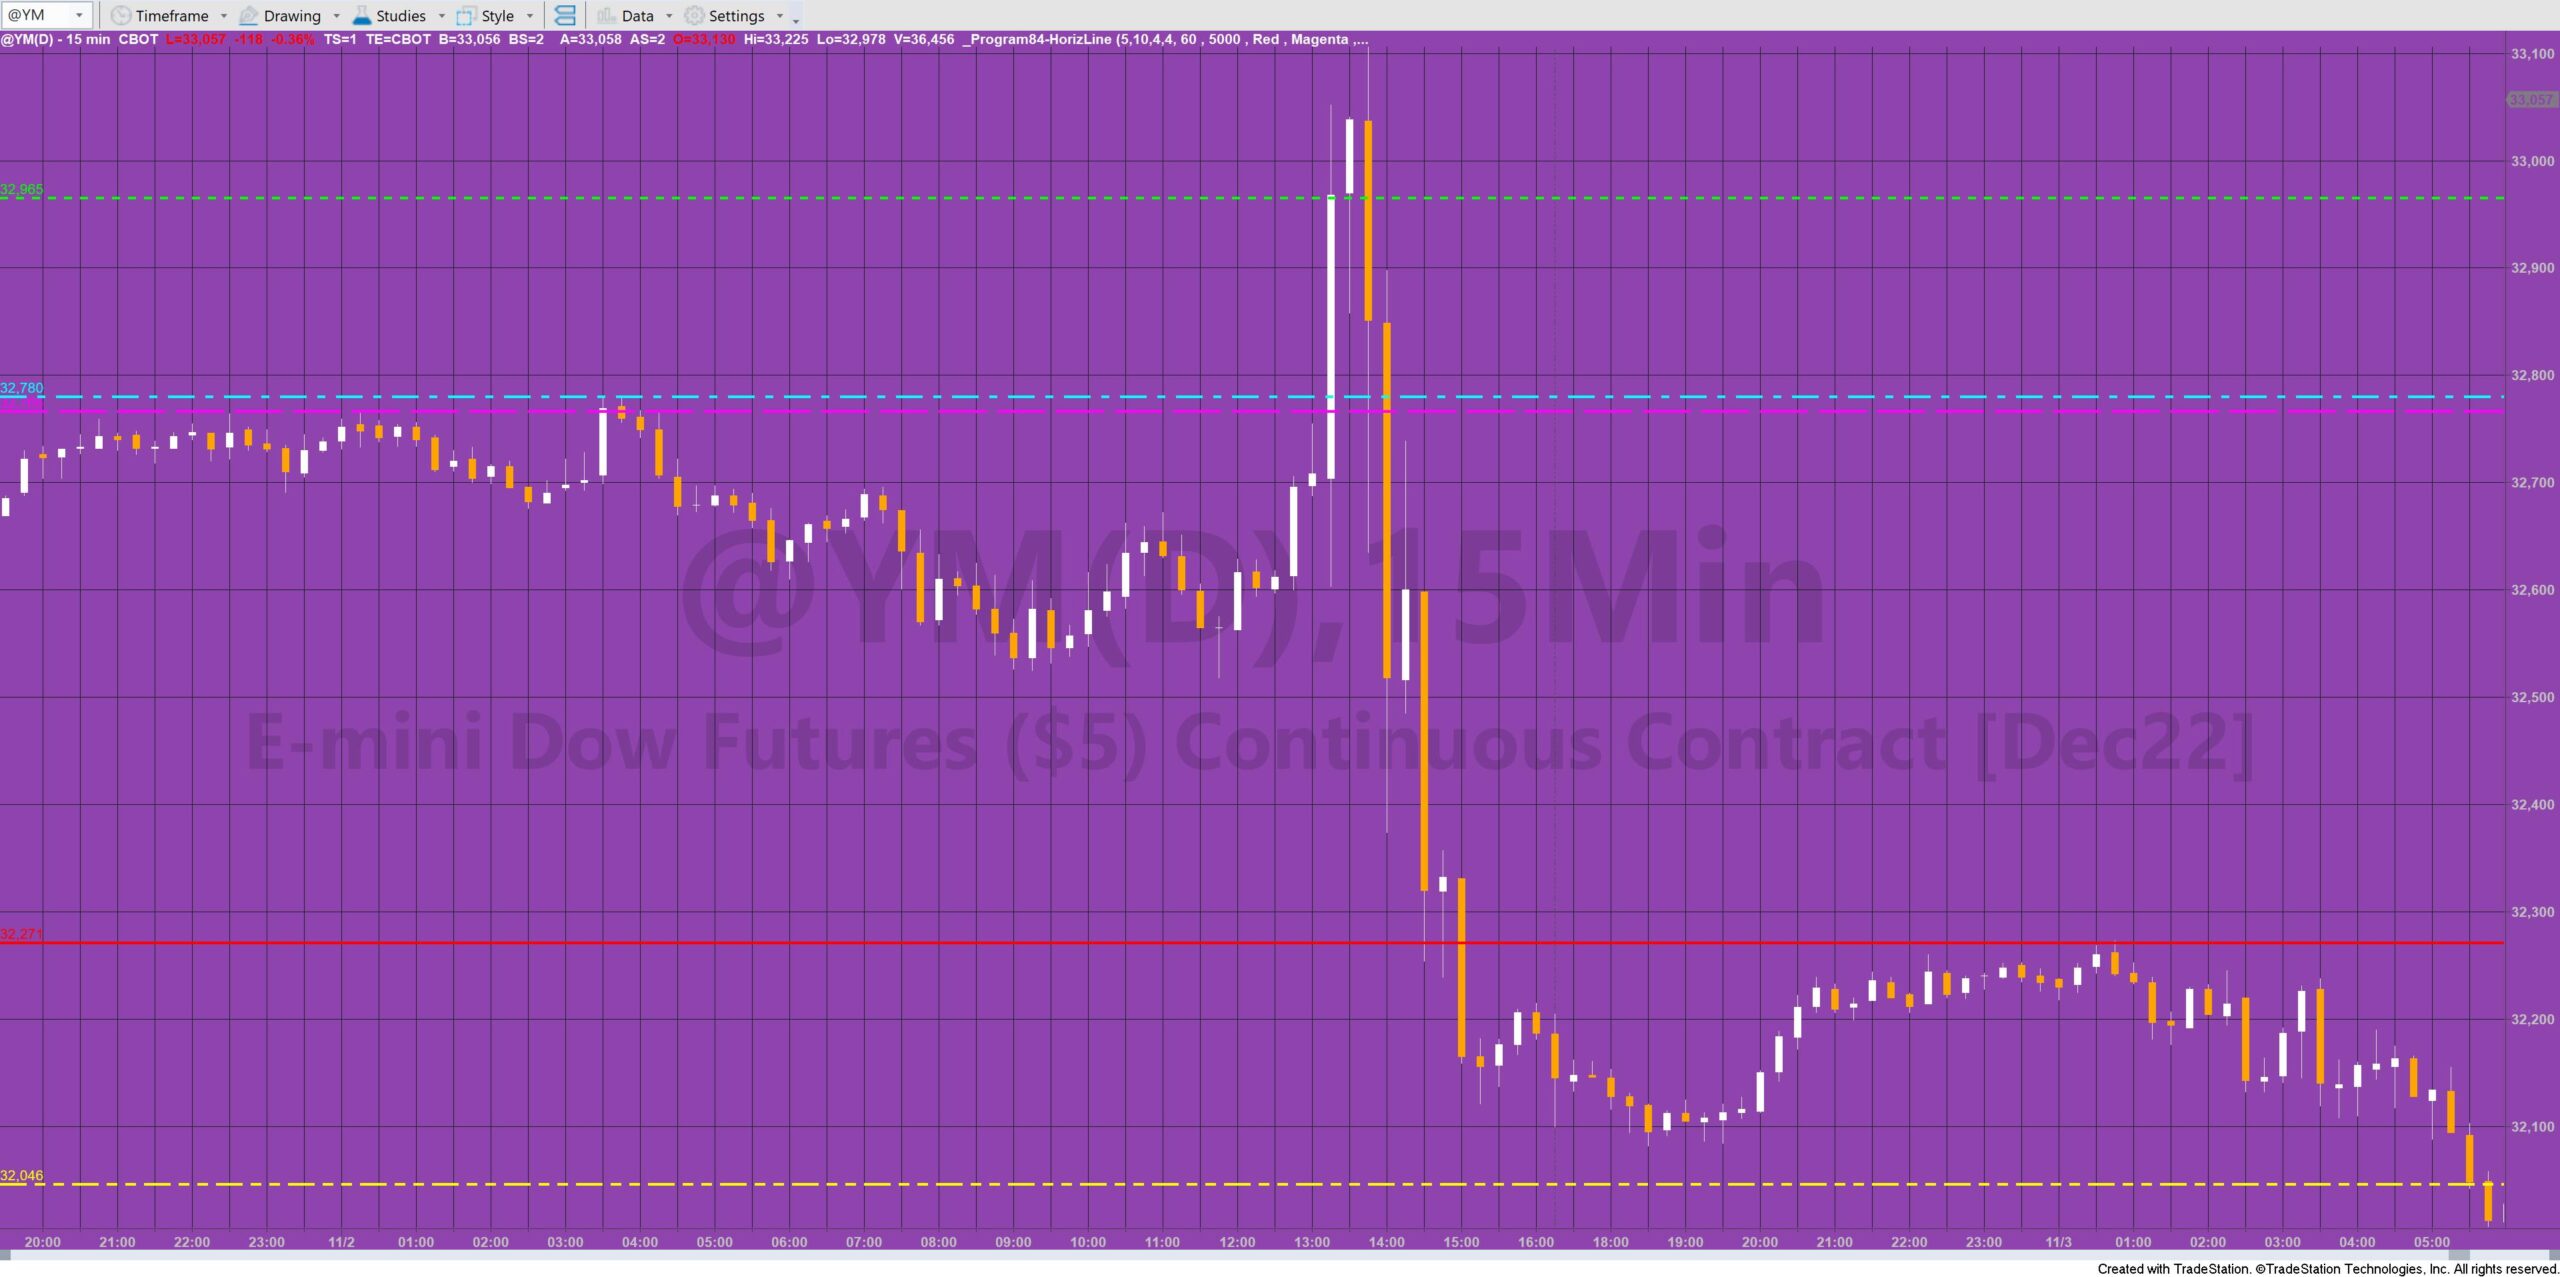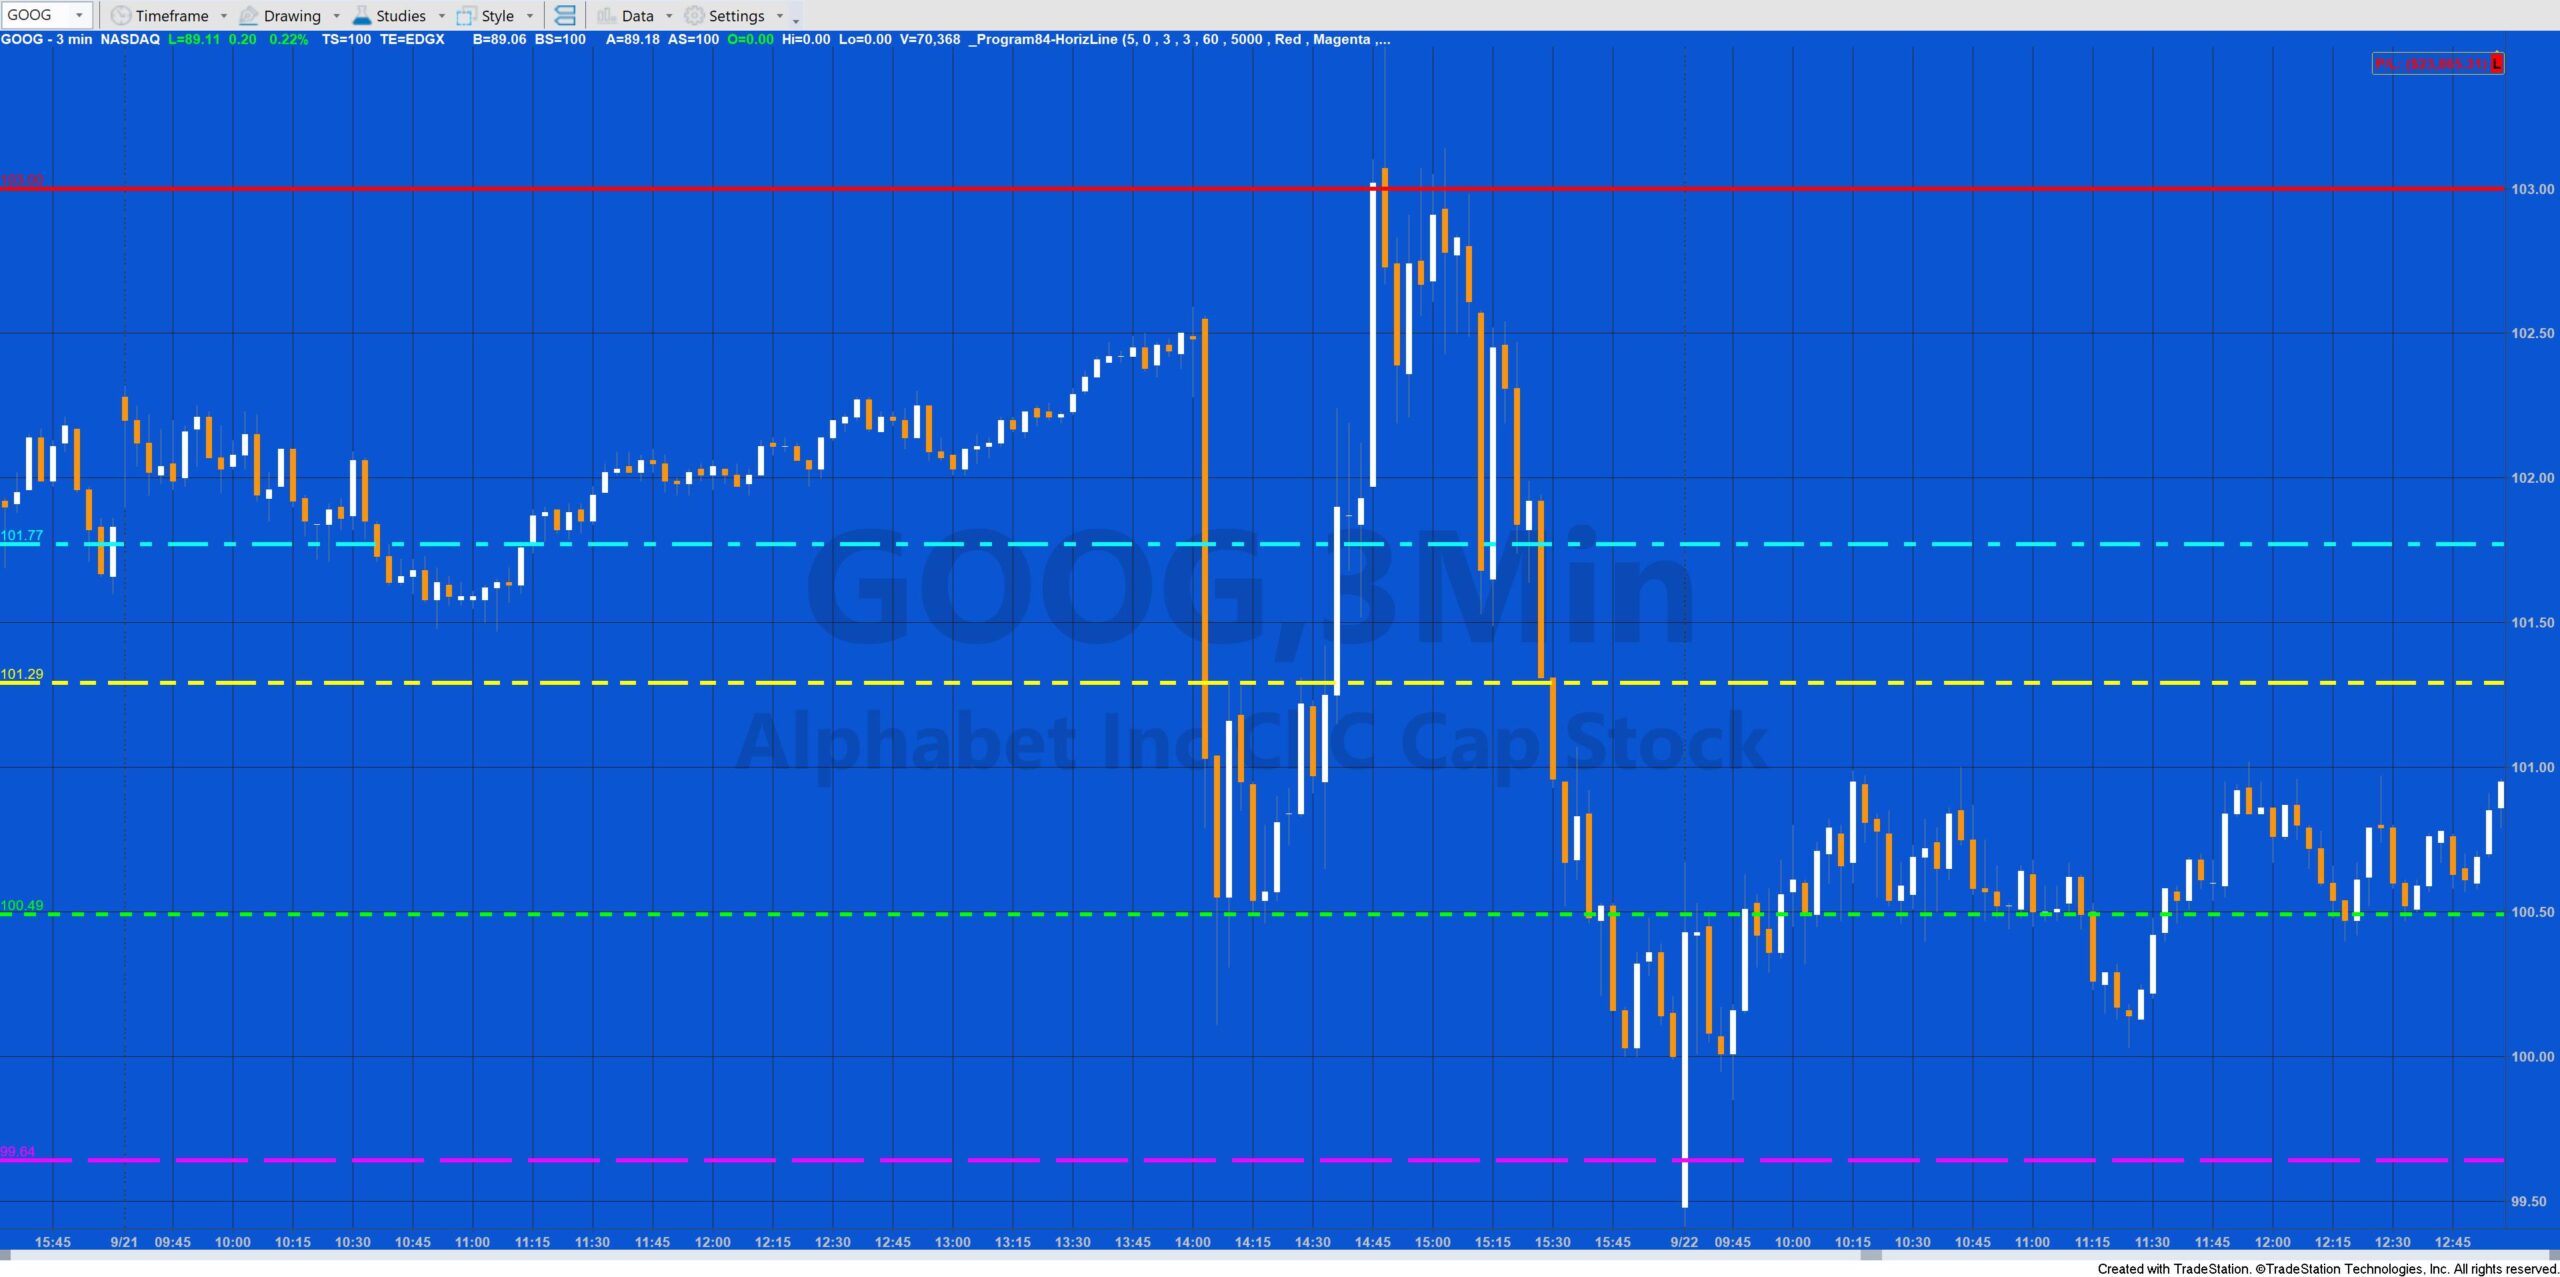
_Program84-HorizLine creates horizontal support and resistance lines based on the record of levels of previous pivots. The program is similar to program 55 but instead of looking for pivots in the bars of the current chart, it uses a price series provider to search for pivots in a different bar interval. The idea behind the program is that if pivots have occurred at a specific level before, then that price level may have some significance, especially if they have occurred at the same level (or near to the same level) on several occasions before.
The program is designed for minute based charts (1, 2, 3, 5, 15 minute etc) with the price series provider having a greater interval. For example, it could be applied to 5 minute bars of @YM and use a 60 minute price series provider. It was written in TradeStation 10. The start time of the PSP is set to the time of the chart (after maxbarsback). Obviously, the more data you load the greater number of pivots will be found.
Each time a new pivot is found in the price series provider, _Program84-HorizLine stores information about the pivot (i.e the datetime it occurred, the number of occurances, with initial value equal to zero, and the price level) in a vector: LineVector. This vector is then stored in another vector: PivotVector.
When the size of the chart changes, the program resamples PivotVector to populate a smaller vector: PivotVectorInRange that just contains levels within the visible area. These levels are ranked based on the number of occurrences at a specific level and how recently the last pivot at that level occurred.
The number of horizontal lines drawn is determined by the user input: TopPivots. The maximum value for TopPivots is 20. If there are fewer pivots meeting the criteria than the value of TopPivots, then fewer are drawn. The CombineVal input determines the maximum price difference between an existing pivot line and a new pivot for the waiting of the new pivot to be increased. LeftStrength and RightStrength determine the number of bars required on each side of a pivot. IntSpan is the interval span of the PSP. UpdateFrequency determines how often the program checks to see if the screen size has changed. The other inputs determine presentation factors like line color, line style and line thickness.
Video explaining program 84
Explanation of program 84 vectors
The tutorial program is not compatible with MultiCharts.
TO THE BEST OF MARKPLEX CORPORATION’S KNOWLEDGE, ALL OF THE INFORMATION ON THIS PAGE IS CORRECT, AND IT IS PROVIDED IN THE HOPE THAT IT WILL BE USEFUL. HOWEVER, MARKPLEX CORPORATION ASSUMES NO LIABILITY FOR ANY DAMAGES, DIRECT OR OTHERWISE, RESULTING FROM THE USE OF THIS INFORMATION AND/OR PROGRAM(S) DESCRIBED, AND NO WARRANTY IS MADE REGARDING ITS ACCURACY OR COMPLETENESS. USE OF THIS INFORMATION AND/OR PROGRAMS DESCRIBED IS AT YOUR OWN RISK.
ANY EASYLANGUAGE OR POWERLANGUAGE TRADING STRATEGIES, SIGNALS, STUDIES, INDICATORS, SHOWME STUDIES, PAINTBAR STUDIES, PROBABILITYMAP STUDIES, ACTIVITYBAR STUDIES, FUNCTIONS (AND PARTS THEREOF) AND ASSOCIATED TECHNIQUES REFERRED TO, INCLUDED IN OR ATTACHED TO THIS TUTORIAL OR PROGRAM DESCRIPTION ARE EXAMPLES ONLY, AND HAVE BEEN INCLUDED SOLELY FOR EDUCATIONAL PURPOSES. MARKPLEX CORPORATION. DOES NOT RECOMMEND THAT YOU USE ANY SUCH TRADING STRATEGIES, SIGNALS, STUDIES, INDICATORS, SHOWME STUDIES, PAINTBAR STUDIES, PROBABILITYMAP STUDIES, ACTIVITYBAR STUDIES, FUNCTIONS (OR ANY PARTS THEREOF) OR TECHNIQUES. THE USE OF ANY SUCH TRADING STRATEGIES, SIGNALS, STUDIES, INDICATORS, SHOWME STUDIES, PAINTBAR STUDIES, PROBABILITYMAP STUDIES, ACTIVITYBAR STUDIES, FUNCTIONS AND TECHNIQUES DOES NOT GUARANTEE THAT YOU WILL MAKE PROFITS, INCREASE PROFITS, OR MINIMIZE LOSSES.


