
Horizontal plots to the right of the normal plots
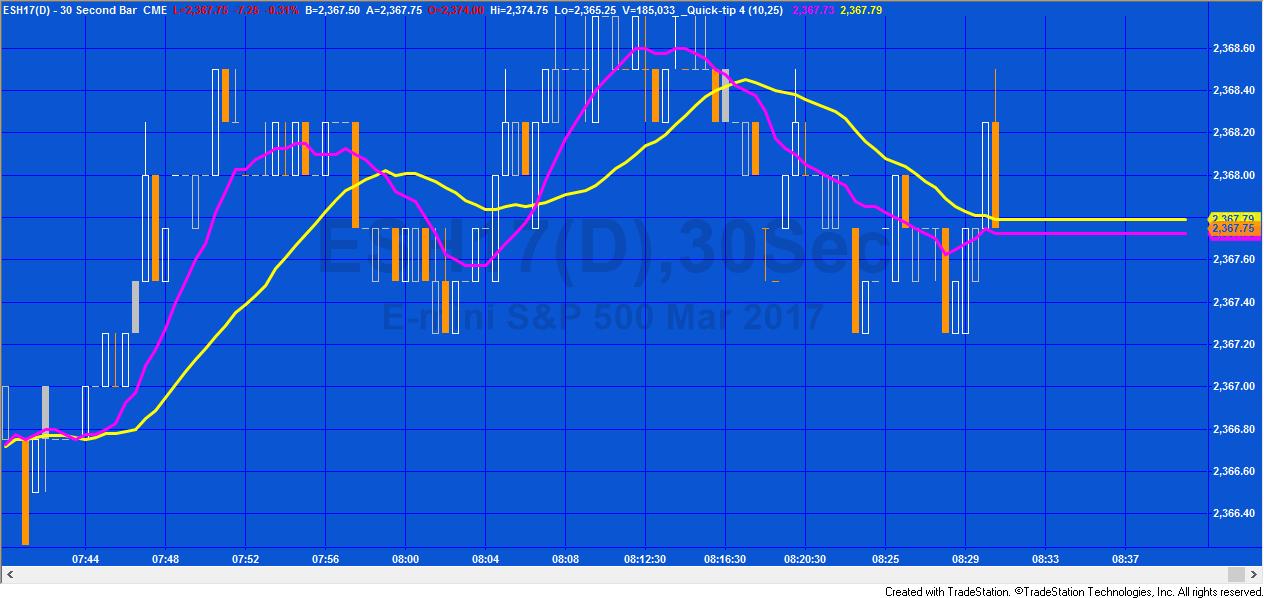
With EasyLanguage it is very easy to use the plot statement. For example, if you wished to plot a fast and a slow average, you could write a indicator program such as the following:
Inputs: int FastLength( 5 ),
int SlowLength( 18 );

Var: double FastAvg( 0 ),
double SlowAvg( 0 );

// Calculate the averages
FastAvg = AverageFC( C, FastLength );
SlowAvg = AverageFC( C, SlowLength );

// Plot the averages
Plot1( FastAvg, "FastAvg", Magenta );
Plot2( SlowAvg, "SlowAvg", Yellow );
We can modify the code to extend the lines horizontally to get a chart as follows:
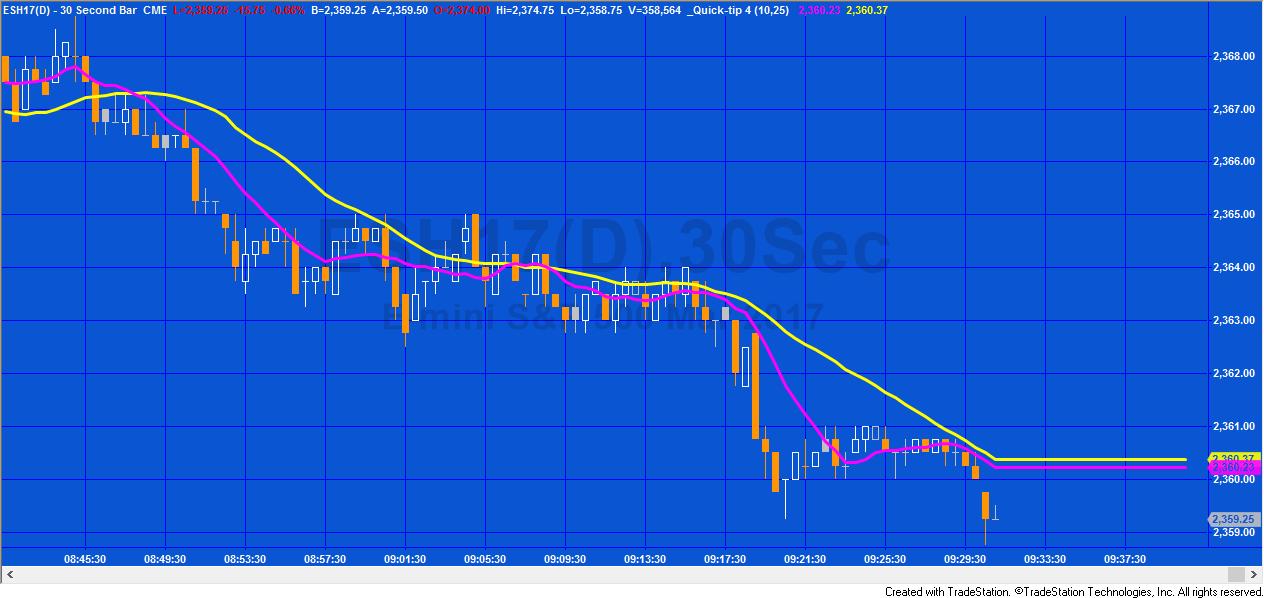
Using the following code:
Inputs: int FastLength( 5 ), int SlowLength( 18 );

Var: double FastAvg( 0 ), double SlowAvg( 0 );

// Calculate the averages
FastAvg = AverageFC( C, FastLength );
SlowAvg = AverageFC( C, SlowLength );

// Plot the averages
Plot1( FastAvg, "FastAvg", Magenta );
Plot2( SlowAvg, "SlowAvg", Yellow );

// Extend the plots to the right
If LastBarOnChart = true then
begin
Plot1[-1 * ( GetAppInfo( aiSpaceToRight ) - 1 )]( FastAvg, "FastAvg", Magenta );
Plot2[-1 * ( GetAppInfo( aiSpaceToRight ) - 1 )]( SlowAvg, "SlowAvg", Yellow );
End;

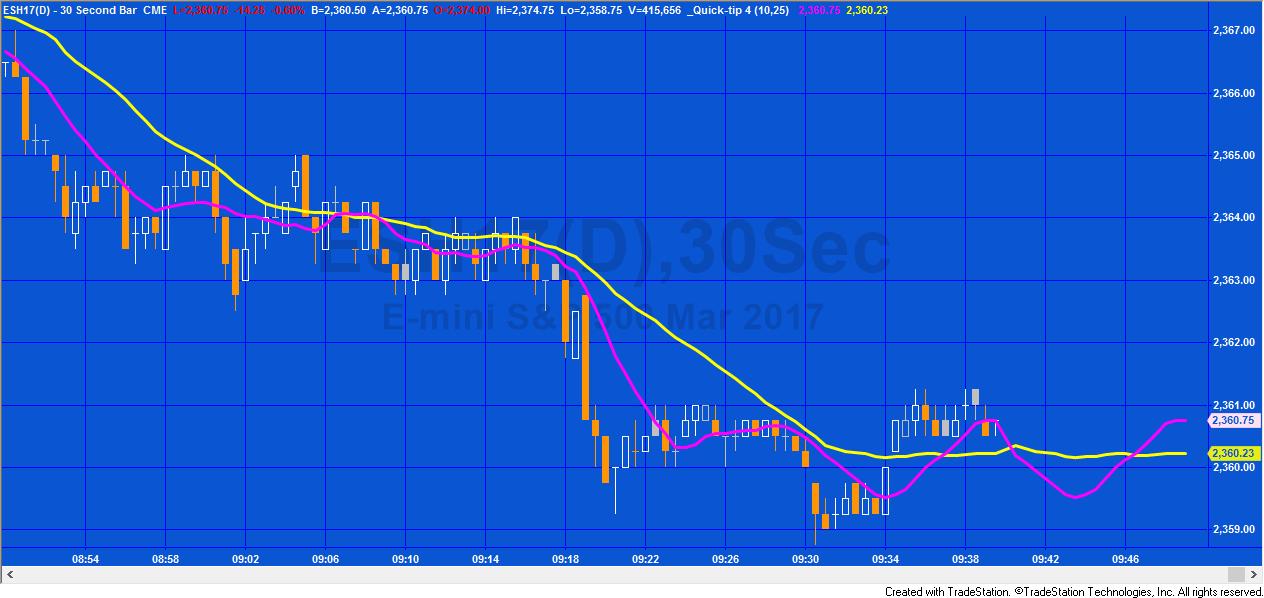
In this code, for the last bar on chart, the plot statements plot the current value of each of the averages in the future (notice the negative number in the square brackets in the plot statements). It assumes that the “Don’t automatically connect plot lines” box in not checked in the plot format window.
Unfortunately as more bars are formed the chart begins to looks like the following:
The solution is to modify the code as follows:
Inputs: int FastLength( 5 ),
int SlowLength( 18 );

Var: double FastAvg( 0 ),
double SlowAvg( 0 );

// Calculate the averages
FastAvg = AverageFC( C, FastLength );
SlowAvg = AverageFC( C, SlowLength );

// Plot the averages
Plot1( FastAvg, "FastAvg", Magenta );
Plot2( SlowAvg, "SlowAvg", Yellow );

// Extend the plots to the right
If LastBarOnChart = true then
begin
For Value1 = 0 to GetAppInfo( aiSpaceToRight ) - 1
Begin
Plot1[-1 * Value1]( FastAvg, "FastAvg", Magenta );
Plot2[-1 * Value1]( SlowAvg, "SlowAvg", Yellow );
End;
End;
The result can be seen in the following short video:
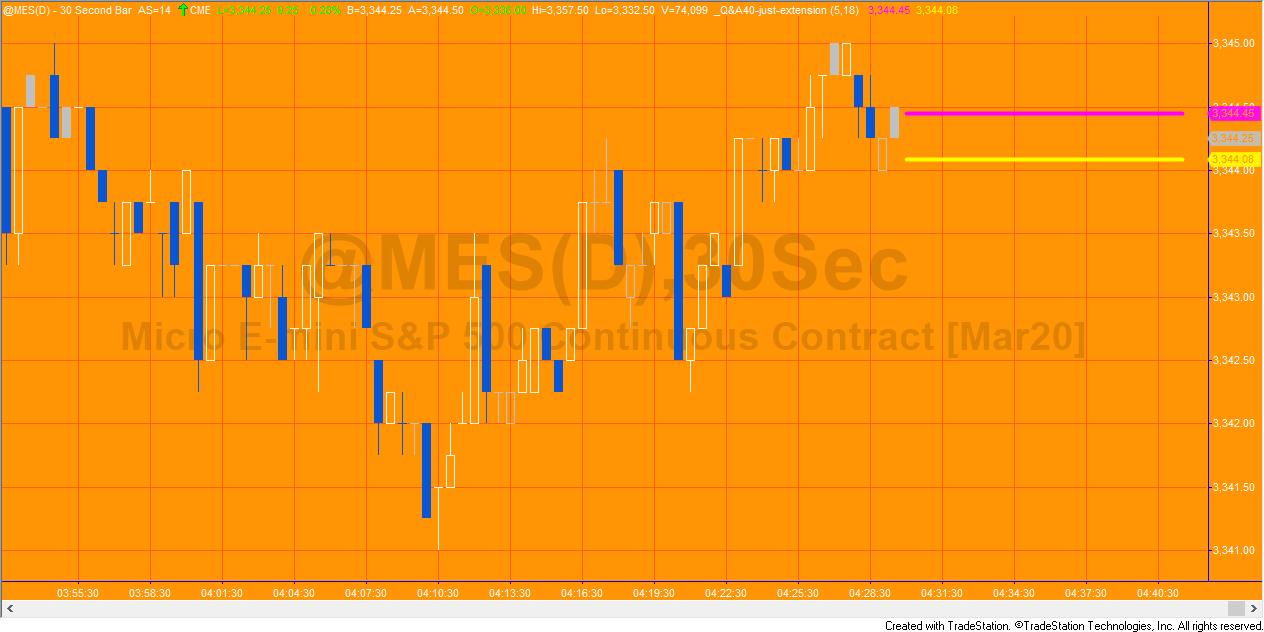 A Gold Pass member wanted to know how to plot the horizontal lines without the rest of the plot, as in the image above.