
Quick-tip 66 explains why sometimes studies applied to RadarScreen can give different values from the same study applied to a chart with the same settings, and vice-versa and how to avoid this.
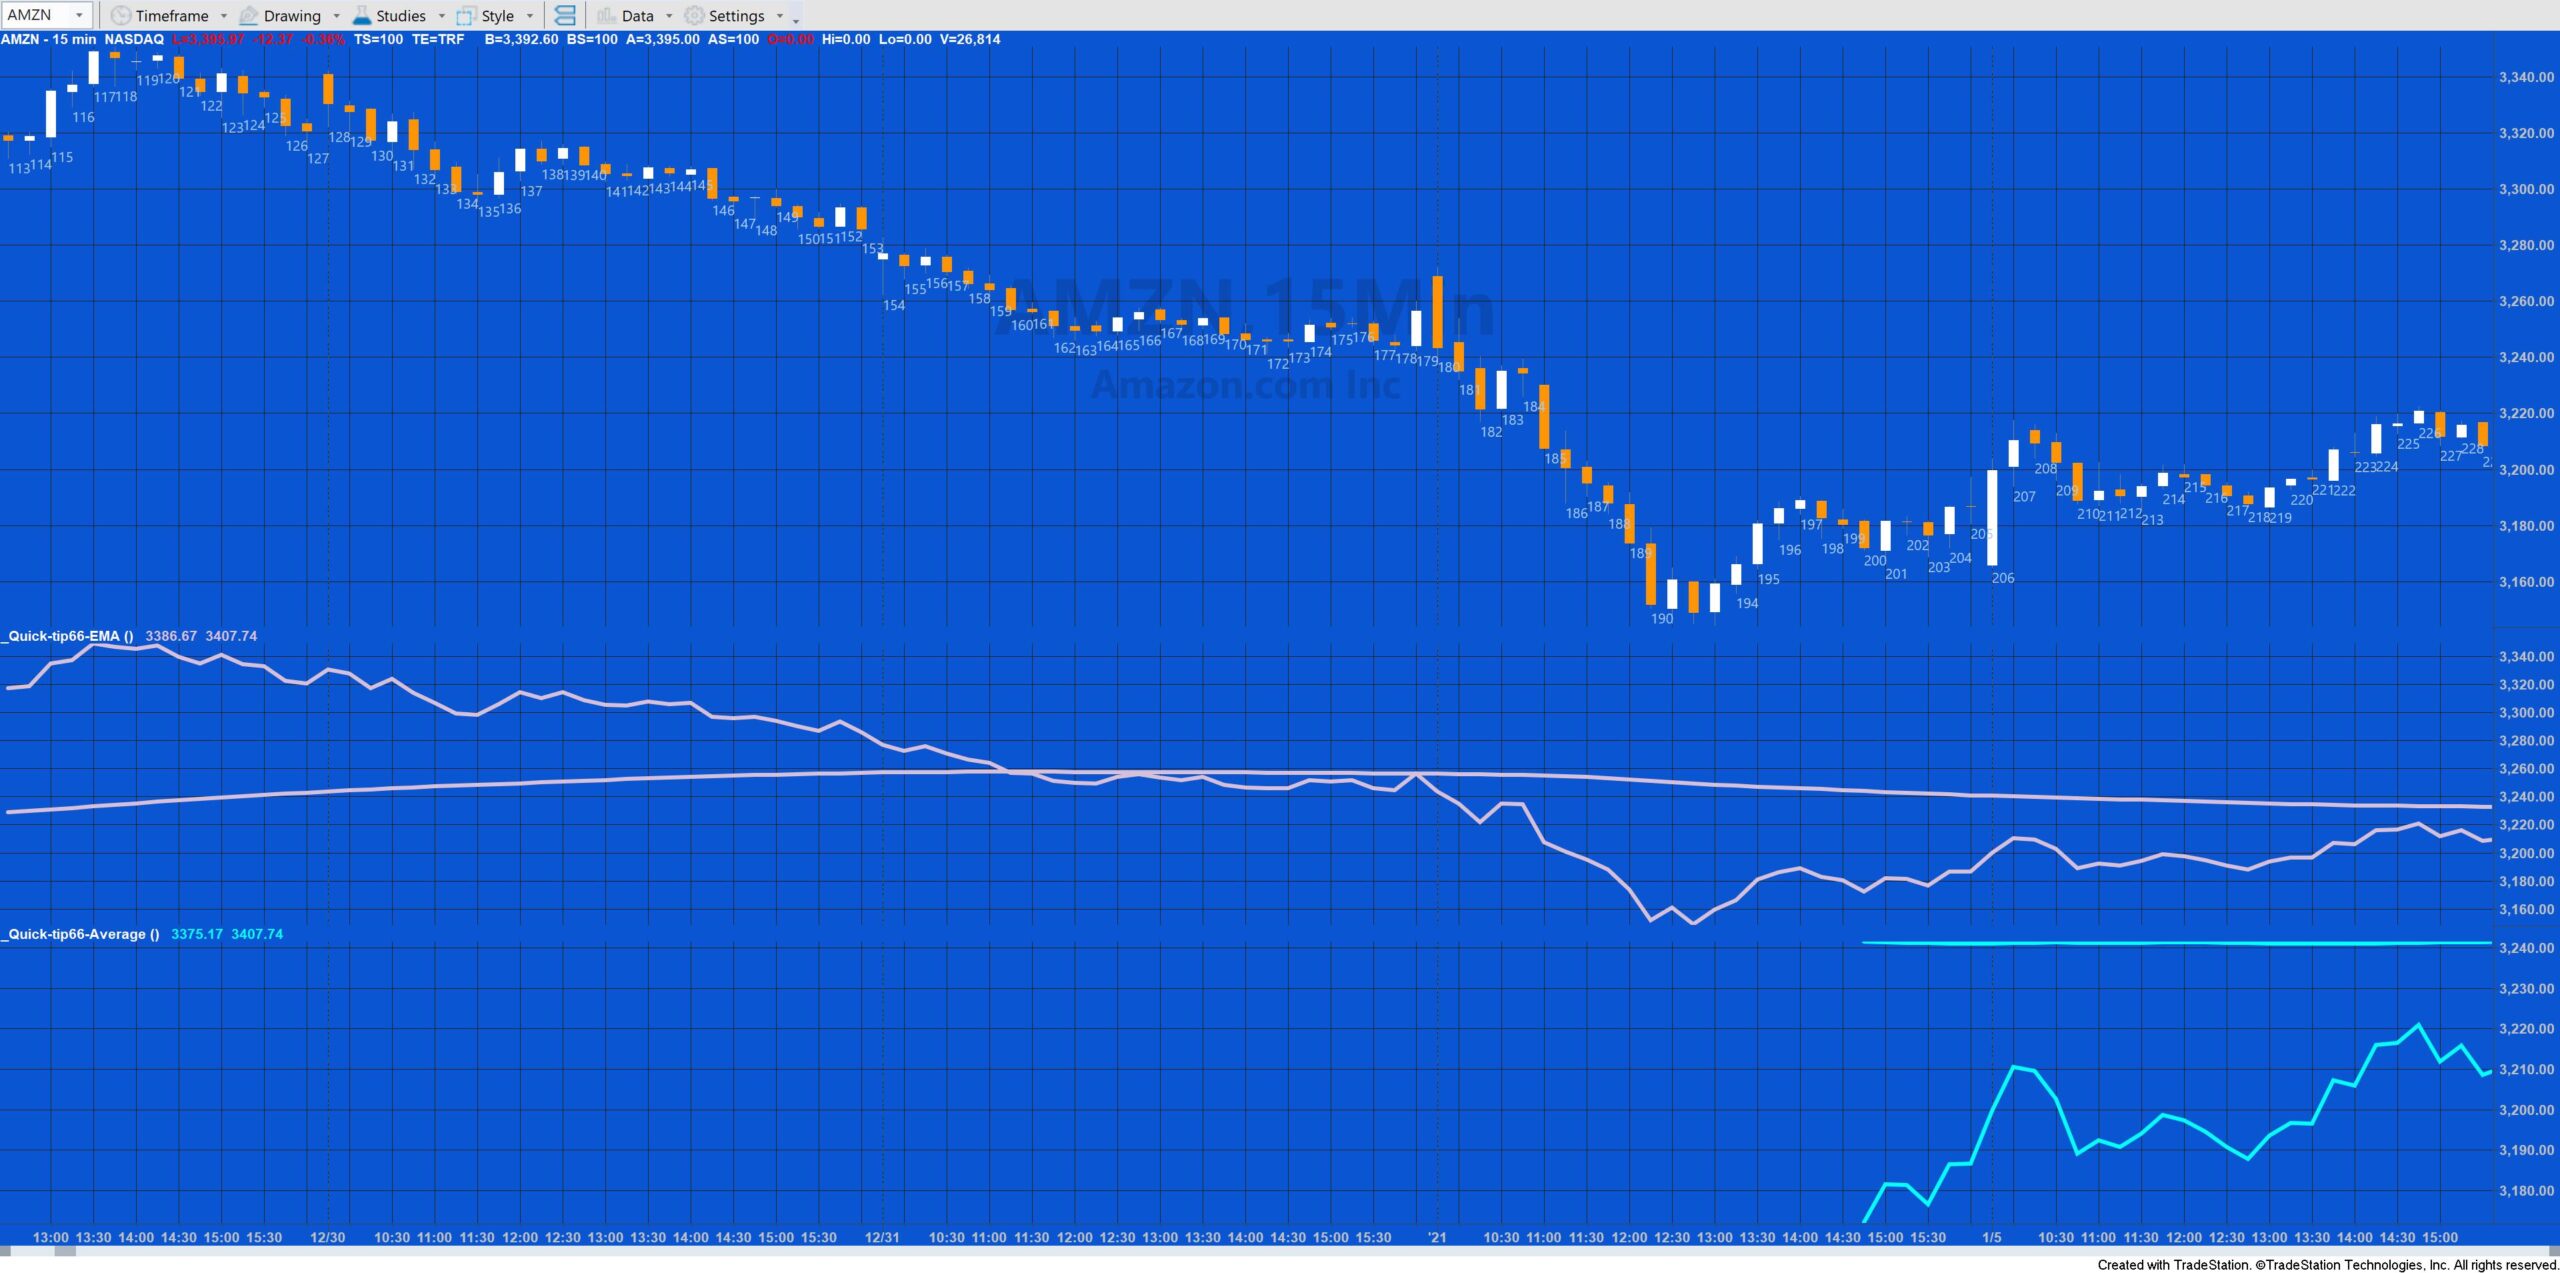
To demonstrate quick-tip 66 uses an exponential moving average (EMA) and a simple moving average applied to both chart and Radarscreen.
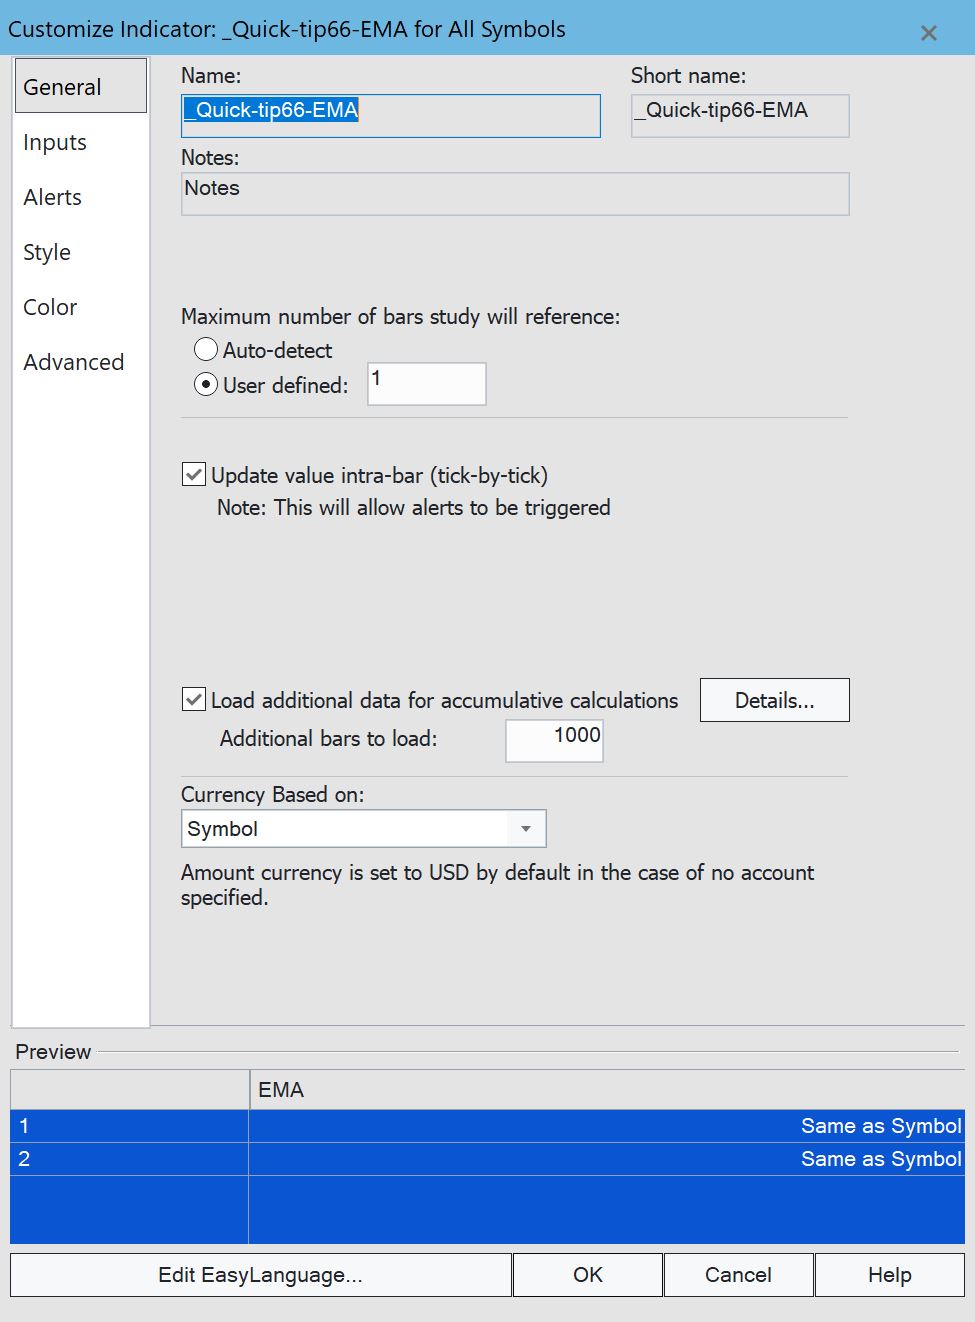
The EMA is an example of an accumulated calculation. This means that each new bar uses the value of a calculation from the previous bar. In practical terms this means that on a chart the EMA program can begin calculating immediately but the initial values will take a large number of bars to converge to an accurate value. On RadarScreen we need to load additional data to get the same result. Finding the exact number of bars to load can be done by trial and error using the guidelines included on the TradeStation dialog (see the details button next to the Load Additional Data). Note that with this program, there is no advantage to adding bars in the “Maximum Number of bars study will reference” box.
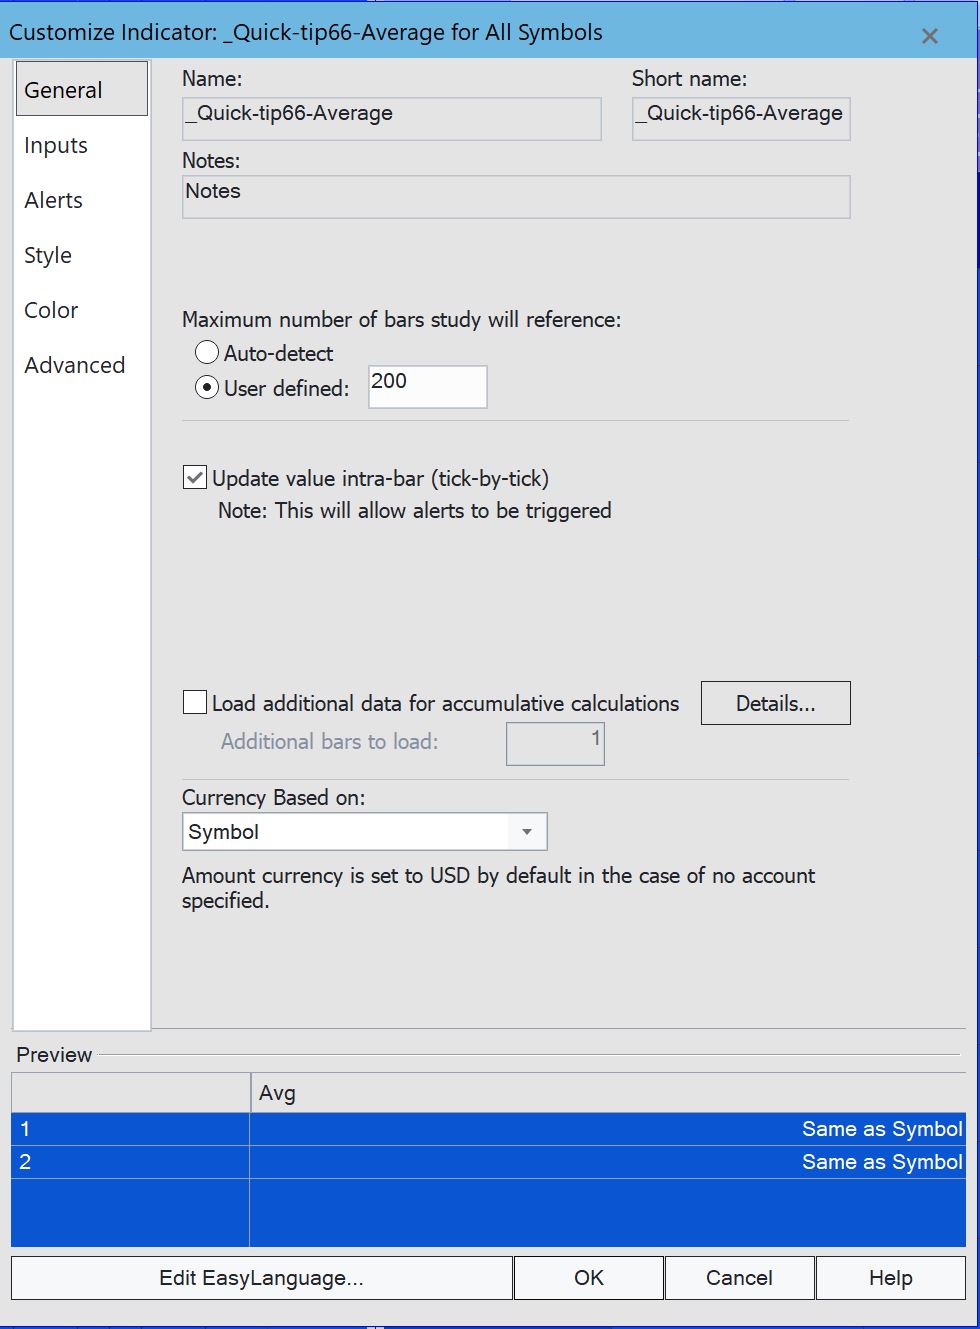 The simple moving average works by looking back from the bar being calculated. In this example, it counts back the length of bars and sums their value. So if the Length is set to 200 (as in the video) it counts back 200 bars. When applied to a chart this means that the calculation starts after 200 bars. In RadarScreen you can either leave the “Maximum Number of bars study will reference” to Auto-detect or enter a user defined value of 200. With some programs you will need to enter an appropriate user defined number. With this simple moving average program, there is no advantage in ‘loading additional data.’
Video explanation of quick-tip 66
Quick-tip 66 code
{ THIS INDICATOR IS PROVIDED IN THE HOPE THAT IT WILL BE USEFUL. HOWEVER, MARKPLEX CORPORATION ASSUMES NO LIABILITY FOR ANY DAMAGES,
DIRECT OR OTHERWISE, RESULTING FROM THE USE OF THIS INFORMATION, AND NO WARRANTY IS MADE REGARDING ITS ACCURACY OR COMPLETENESS.
USE OF THIS INFORMATION IS AT YOUR OWN RISK. THIS INDICATOR AND ASSOCIATED TECHNIQUES IS AN EXAMPLE ONLY, AND HAS BEEN INCLUDED
SOLELY FOR EDUCATIONAL PURPOSES. MARKPLEX CORPORATION DOES NOT RECOMMEND THAT YOU USE ANY SUCH TRADING STRATEGIES, INDICATORS, SHOWME
STUDIES, PAINTBAR STUDIES, PROBABILITYMAP STUDIES, ACTIVITYBAR STUDIES, FUNCTIONS (OR ANY PARTS THEREOF) OR TECHNIQUES. THE USE
OF THIS INDICATOR DOES NOT GUARANTEE THAT YOU WILL MAKE PROFITS, INCREASE PROFITS, OR MINIMIZE LOSSES.}

Once
Begin
	If GetAppInfo( aiApplicationType ) = 1 then Print( "_Quick-tip66-EMA on the chart ", MaxbarsBack, " Date & time ", BarDateTime.Format( "%m-%d-%y %H:%M" ) );
	If GetAppInfo( aiApplicationType ) = 2 then Print( "_Quick-tip66-EMA on RadarScreen ", MaxbarsBack, " Date & time ", BarDateTime.Format( "%m-%d-%y %H:%M" ) );
 End;

 Value2 = Text_New( D, T, L, NumToStr( BarNumber, 0 ) );

Value1 = XAverage( C, 200 );
Plot1( Value1, "EMA", RGB( 216, 191, 216 ) );
Plot2( C, "C", RGB( 216, 191, 216 ) );

{ ** Copyright (c) 2021 Markplex Corporation. All rights reserved. **
** Markplex Corporation reserves the right to modify or overwrite
this analysis technique on its https://markplex.com Web site. ** }
{ THIS INDICATOR IS PROVIDED IN THE HOPE THAT IT WILL BE USEFUL. HOWEVER, MARKPLEX CORPORATION ASSUMES NO LIABILITY FOR ANY DAMAGES,
DIRECT OR OTHERWISE, RESULTING FROM THE USE OF THIS INFORMATION, AND NO WARRANTY IS MADE REGARDING ITS ACCURACY OR COMPLETENESS.
USE OF THIS INFORMATION IS AT YOUR OWN RISK. THIS INDICATOR AND ASSOCIATED TECHNIQUES IS AN EXAMPLE ONLY, AND HAS BEEN INCLUDED
SOLELY FOR EDUCATIONAL PURPOSES. MARKPLEX CORPORATION DOES NOT RECOMMEND THAT YOU USE ANY SUCH TRADING STRATEGIES, INDICATORS, SHOWME
STUDIES, PAINTBAR STUDIES, PROBABILITYMAP STUDIES, ACTIVITYBAR STUDIES, FUNCTIONS (OR ANY PARTS THEREOF) OR TECHNIQUES. THE USE
OF THIS INDICATOR DOES NOT GUARANTEE THAT YOU WILL MAKE PROFITS, INCREASE PROFITS, OR MINIMIZE LOSSES.}

Once
Begin
	If GetAppInfo( aiApplicationType ) = 1 then Print( "_Quick-tip66-Average on the chart ", MaxbarsBack, " Date & time ", BarDateTime.Format( "%m-%d-%y %H:%M" ) );
	If GetAppInfo( aiApplicationType ) = 2 then Print( "_Quick-tip66-Average on RadarScreen ", MaxbarsBack, " Date & time ", BarDateTime.Format( "%m-%d-%y %H:%M" ) );
 End;

Value1 = Average( C, 200 );
Plot1( Value1,"Avg", Cyan );
Plot2( C, "C", Cyan );


{ ** Copyright (c) 2021 Markplex Corporation. All rights reserved. **
** Markplex Corporation reserves the right to modify or overwrite
this analysis technique on its https://markplex.com Web site. ** }
THE TRADING APPS, INDICATORS, SHOW ME STUDIES, STRATEGIES AND OTHER PROGRAMS HAVE BEEN INCLUDED SOLELY FOR EDUCATIONAL PURPOSES.
TO THE BEST OF MARKPLEX CORPORATION’S KNOWLEDGE, ALL OF THE INFORMATION ON THIS PAGE IS CORRECT, AND IT IS PROVIDED IN THE HOPE THAT IT WILL BE USEFUL. HOWEVER, MARKPLEX CORPORATION ASSUMES NO LIABILITY FOR ANY DAMAGES, DIRECT OR OTHERWISE, RESULTING FROM THE USE OF THIS INFORMATION AND/OR PROGRAM(S) DESCRIBED, AND NO WARRANTY IS MADE REGARDING ITS ACCURACY OR COMPLETENESS. USE OF THIS INFORMATION AND/OR PROGRAMS DESCRIBED IS AT YOUR OWN RISK.
ANY EASYLANGUAGE OR POWERLANGUAGE TRADING STRATEGIES, TRADING APPS, SIGNALS, STUDIES, INDICATORS, SHOWME STUDIES, PAINTBAR STUDIES, PROBABILITYMAP STUDIES, ACTIVITYBAR STUDIES, FUNCTIONS (AND PARTS THEREOF) AND ASSOCIATED TECHNIQUES REFERRED TO, INCLUDED IN OR ATTACHED TO THIS TUTORIAL OR PROGRAM DESCRIPTION ARE EXAMPLES ONLY, AND HAVE BEEN INCLUDED SOLELY FOR EDUCATIONAL PURPOSES. MARKPLEX CORPORATION. DOES NOT RECOMMEND THAT YOU USE ANY SUCH TRADING STRATEGIES, SIGNALS, STUDIES, INDICATORS, SHOWME STUDIES, PAINTBAR STUDIES, PROBABILITYMAP STUDIES, ACTIVITYBAR STUDIES, FUNCTIONS (OR ANY PARTS THEREOF) OR TECHNIQUES. THE USE OF ANY SUCH TRADING STRATEGIES, SIGNALS, STUDIES, INDICATORS, SHOWME STUDIES, PAINTBAR STUDIES, PROBABILITYMAP STUDIES, ACTIVITYBAR STUDIES, FUNCTIONS AND TECHNIQUES DOES NOT GUARANTEE THAT YOU WILL MAKE PROFITS, INCREASE PROFITS, OR MINIMIZE LOSSES.