

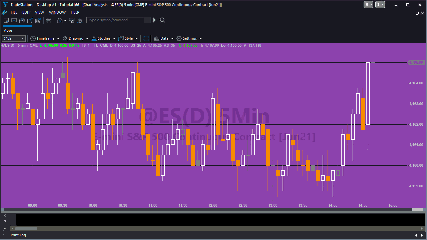
_Tutorial 166 demonstrates a technique that ensures that a drawing object remains visible in the chart window, even if price activity is no longer in the region of the chart where the drawing object is positioned. In this specific example a horizontal line is drawn at the level of the highest high over a user input number of bars. As I scroll backwards in time the price action moves away from the horizontal line, however, the tutorial program ensures that the horizontal line remains visible.
The program includes a method named: FindHiLoOnScreen( ). This method determines the highest and lowest prices visible on the screen. The values change as you scroll backwards and forwards to different time frames. To achieve this, the method counts backwards from the last bar on the chart and when it determines it is within the range of date time visible on the chart it determines the high and the low for the screen.
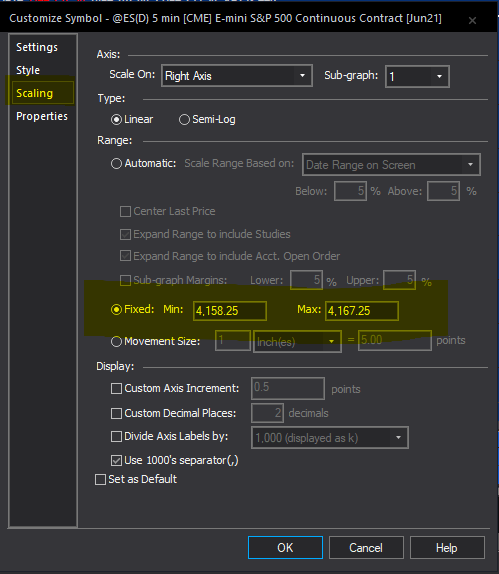
Another method: UpdateMinMax( ) checks whether the horizontal line value is higher than the highest price on the screen. If so, it changes the scale to include the lowest price and the value of the horizontal line. It also checks whether the horizontal line value is lower than the lowest price on the screen. If so, it changes the scale to include the value of the horizontal line and the highest price value. If the value of the line is between the highest and lowest prices on the screen it sets the range between the lowest and the highest prices. To change the fixed scaling values the program uses the .FixedMax and .FixedMin macro commands. Note: the chart range is actually increased by the minimum move amount to ensure that the horizontal lines are visible.
These two methods are called once on the last bar on the chart and subsequently every time a timer elapsed event occurs if the horizontal scaling has changed or the value of the horizontal line is greater than the maximum value or less than the minimum value displayed. These conditions are used to ensure the methods are not called needlessly.
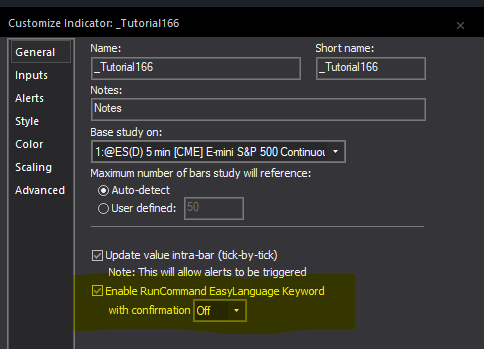
Because the program uses RunCommand to run the macros, the “Enable RunCommand EasyLanguage keyword” must be selected for the tutorial program to run completely.
Technical lessons
The programming techniques discussed include:
- Using the timer and the elapsed event
- Creating an horizontal line and adding it to the chart
- Converting between the legacy DateTime double to a DateTime object
- Using GetAppInfo to find the highest/lowest values and the right/left date time for the current screen
- Creating simple methods
- Running macros to change scaling
Video walk through of the tutorial program
Download the tutorial 166 TradeStation EasyLanguage indicator
If you want to save yourself some typing, the tutorial 166 program is available for immediate download for $19.95 by clicking the following button. You can pay using PayPal or credit card. The program works with TradeStation 9.5, and TradeStation 10 but, unfortunately, is not compatible with MultiCharts.
The download consists of _Tutorial166 (the program developed in the tutorial).
The indicator is not protected, in other words, you will be able to see, modify and experiment with the tutorial’s code.
Gold Pass area
This tutorial is available for download at no additional cost by Gold Pass members. Make sure you are logged in.
THE TRADING APPS, INDICATORS, SHOW ME STUDIES, STRATEGIES AND OTHER PROGRAMS HAVE BEEN INCLUDED SOLELY FOR EDUCATIONAL PURPOSES.
TO THE BEST OF MARKPLEX CORPORATION’S KNOWLEDGE, ALL OF THE INFORMATION ON THIS PAGE IS CORRECT, AND IT IS PROVIDED IN THE HOPE THAT IT WILL BE USEFUL. HOWEVER, MARKPLEX CORPORATION ASSUMES NO LIABILITY FOR ANY DAMAGES, DIRECT OR OTHERWISE, RESULTING FROM THE USE OF THIS INFORMATION AND/OR PROGRAM(S) DESCRIBED, AND NO WARRANTY IS MADE REGARDING ITS ACCURACY OR COMPLETENESS. USE OF THIS INFORMATION AND/OR PROGRAMS DESCRIBED IS AT YOUR OWN RISK.
ANY EASYLANGUAGE OR POWERLANGUAGE TRADING STRATEGIES, TRADING APPS, SIGNALS, STUDIES, INDICATORS, SHOWME STUDIES, PAINTBAR STUDIES, PROBABILITYMAP STUDIES, ACTIVITYBAR STUDIES, FUNCTIONS (AND PARTS THEREOF) AND ASSOCIATED TECHNIQUES REFERRED TO, INCLUDED IN OR ATTACHED TO THIS TUTORIAL OR PROGRAM DESCRIPTION ARE EXAMPLES ONLY, AND HAVE BEEN INCLUDED SOLELY FOR EDUCATIONAL PURPOSES. MARKPLEX CORPORATION. DOES NOT RECOMMEND THAT YOU USE ANY SUCH TRADING STRATEGIES, SIGNALS, STUDIES, INDICATORS, SHOWME STUDIES, PAINTBAR STUDIES, PROBABILITYMAP STUDIES, ACTIVITYBAR STUDIES, FUNCTIONS (OR ANY PARTS THEREOF) OR TECHNIQUES. THE USE OF ANY SUCH TRADING STRATEGIES, SIGNALS, STUDIES, INDICATORS, SHOWME STUDIES, PAINTBAR STUDIES, PROBABILITYMAP STUDIES, ACTIVITYBAR STUDIES, FUNCTIONS AND TECHNIQUES DOES NOT GUARANTEE THAT YOU WILL MAKE PROFITS, INCREASE PROFITS, OR MINIMIZE LOSSES.