

Tutorial 167 is a TradeStation EasyLanguage tutorial that demonstrates how to calculate the Average True Range (ATR) using a Price Series Provider (PSP).
The technique could be used, for example, to calculate the ATR for a 9 minute interval span, but applied to a 5 minute chart or to apply several ATRs for different bar intervals on a single row in RadarScreen.
The tutorial also shows why the ATR cannot be calculated by using the standard TradeStation function with a PSP.
All the examples in this tutorial use a minute IntervalType.
Make sure that the chart time is set to local (in order to match the PSP).
Tutorial 167 video overview
In the second video I use syntax from _Tutorial 167 to create new program (_Tutorial167-RadarScreen). In this program three PSPs are used to calculate three ATRs each with a different bar intervals. Each interval length is controlled by a user input: IntSpan1, IntSpan2, and IntSpan3.
The program plots four columns as in the following image:
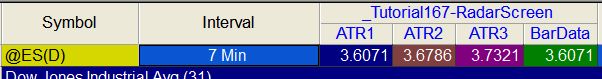
ATR1 is the Average True Range based on an interval span of IntSpan1 (or 7 minutes in this case). ATR2 is the Average True Range based on an interval span of IntSpan2 (or 14 minutes in this case). ATR3 is the Average True Range based on an interval span of IntSpan3 (or 21 minutes in this case). The fourth column, BarData, calculates the ATR based on the data for this row, which has a 7 minite interval. Note that the values of ATR1 and BarData are the same.
Modifying tutorial 167 to show 3 bar intervals in RadarScreen
Download the tutorial 167 TradeStation EasyLanguage indicators
If you want to save yourself some typing, the tutorial 167 code is available for immediate download for $27.50 by clicking the following button. You can pay using PayPal or credit card. The program works with TradeStation 9.5 and 10. It is not compatible with MultiCharts.
The download consists of _Tutorial167 and _Tutorial167-RadarScreen (the TradeStation EasyLanguage indicators developed in the tutorial).
The indicators are not protected, in other words, you will be able to see, modify and experiment with the tutorials’ code.
THE TRADING APPS, INDICATORS, SHOW ME STUDIES, STRATEGIES AND OTHER PROGRAMS HAVE BEEN INCLUDED SOLELY FOR EDUCATIONAL PURPOSES.
TO THE BEST OF MARKPLEX CORPORATION’S KNOWLEDGE, ALL OF THE INFORMATION ON THIS PAGE IS CORRECT, AND IT IS PROVIDED IN THE HOPE THAT IT WILL BE USEFUL. HOWEVER, MARKPLEX CORPORATION ASSUMES NO LIABILITY FOR ANY DAMAGES, DIRECT OR OTHERWISE, RESULTING FROM THE USE OF THIS INFORMATION AND/OR PROGRAM(S) DESCRIBED, AND NO WARRANTY IS MADE REGARDING ITS ACCURACY OR COMPLETENESS. USE OF THIS INFORMATION AND/OR PROGRAMS DESCRIBED IS AT YOUR OWN RISK.
ANY EASYLANGUAGE OR POWERLANGUAGE TRADING STRATEGIES, TRADING APPS, SIGNALS, STUDIES, INDICATORS, SHOWME STUDIES, PAINTBAR STUDIES, PROBABILITYMAP STUDIES, ACTIVITYBAR STUDIES, FUNCTIONS (AND PARTS THEREOF) AND ASSOCIATED TECHNIQUES REFERRED TO, INCLUDED IN OR ATTACHED TO THIS TUTORIAL OR PROGRAM DESCRIPTION ARE EXAMPLES ONLY, AND HAVE BEEN INCLUDED SOLELY FOR EDUCATIONAL PURPOSES. MARKPLEX CORPORATION. DOES NOT RECOMMEND THAT YOU USE ANY SUCH TRADING STRATEGIES, SIGNALS, STUDIES, INDICATORS, SHOWME STUDIES, PAINTBAR STUDIES, PROBABILITYMAP STUDIES, ACTIVITYBAR STUDIES, FUNCTIONS (OR ANY PARTS THEREOF) OR TECHNIQUES. THE USE OF ANY SUCH TRADING STRATEGIES, SIGNALS, STUDIES, INDICATORS, SHOWME STUDIES, PAINTBAR STUDIES, PROBABILITYMAP STUDIES, ACTIVITYBAR STUDIES, FUNCTIONS AND TECHNIQUES DOES NOT GUARANTEE THAT YOU WILL MAKE PROFITS, INCREASE PROFITS, OR MINIMIZE LOSSES.