
Bollinger Band squeeze breakouts
Welcome to Markplex tutorial 98 in this collection of tutorials designed to help you learn TradeStation EasyLanguage programming skills. Please join our email list if you have not already done so and we will let you know when we release new tutorials or programs.
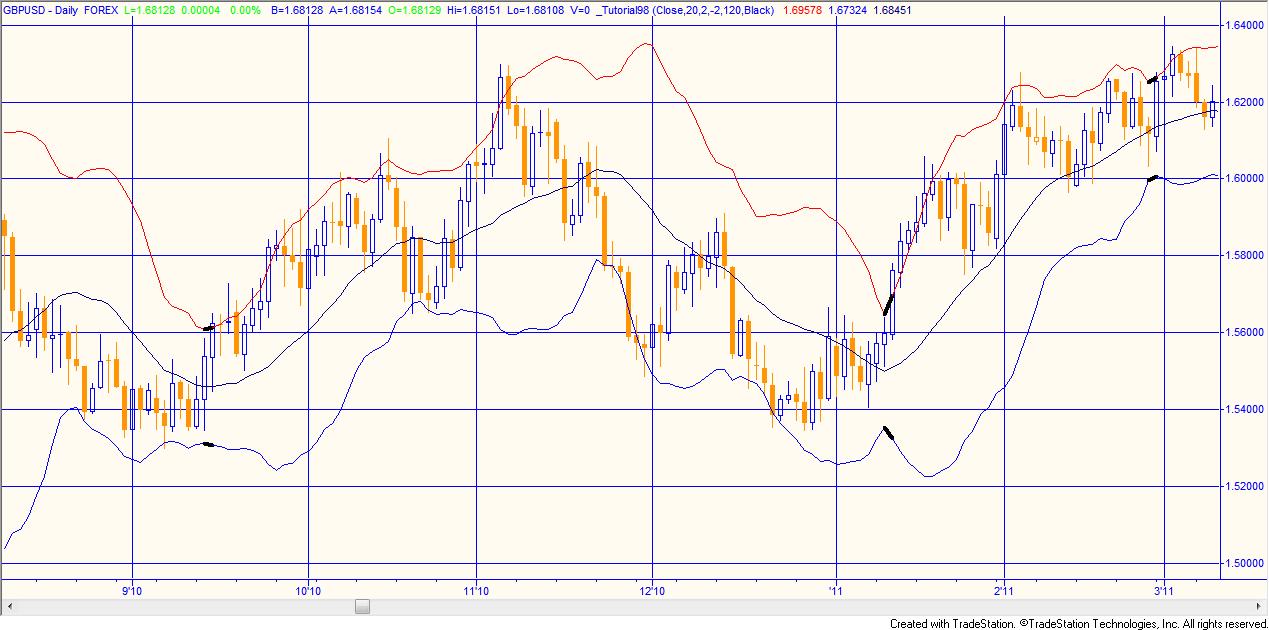
A narrowing of the Bollinger bands is an indication of lower volatility. According to John Bollinger (who created the Bollinger band concept), periods of low volatility are often followed by periods of high volatility. This could mean that a narrowing of the Bollinger bands (or a period of low volatility) –a ‘squeeze’–may foreshadow a period of higher volatility, or a breakout in price.
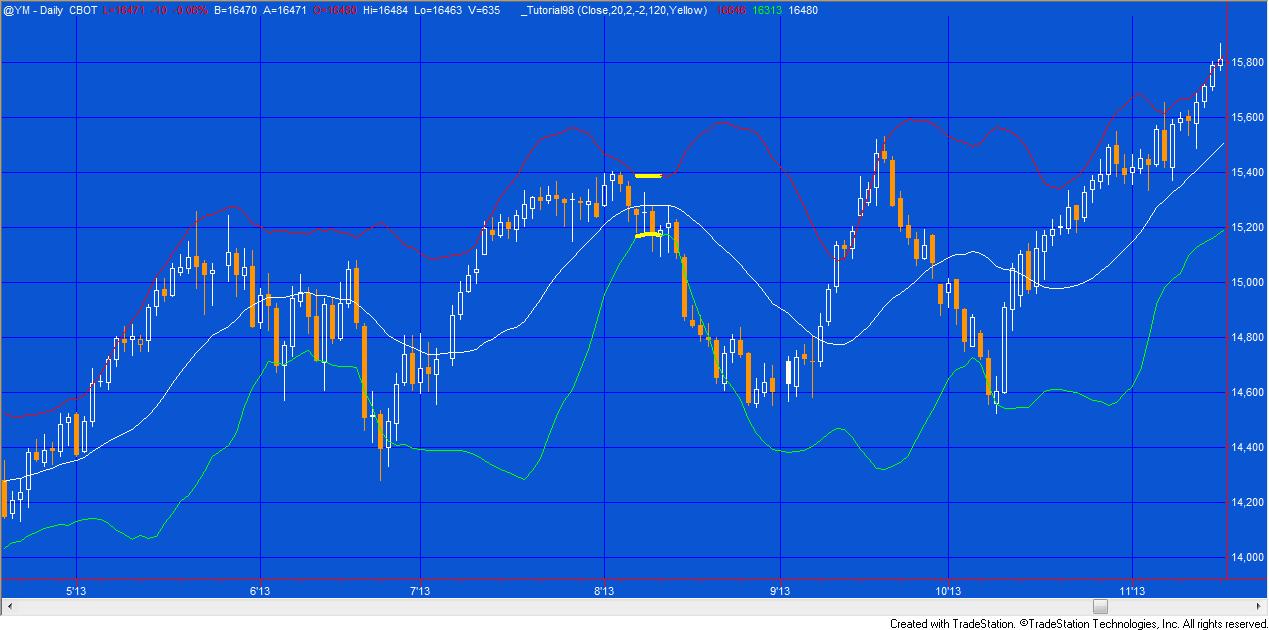
Tutorial 98 demonstrates how to calculate and plot the Bollinger bands, as well as to calculate when the bands narrow to the point when the difference between the high Bollinger band and the low Bollinger band is the lowest in a user input number of bars.
The video below explains the development of the program.
User inputs (explained in the video below)
BollingerPrice( Close ),
Length( 20 ),
NumDevsUp( 2 ),
NumDevsDn( -2 ),
NumBars( 120 ),
SqueezeColor( Yellow );
This tutorial program is available for immediate download for only $19.95.
Gold Pass members get an additional 20% discount off all program and tutorial prices. If you are a Gold Pass member make sure you enter the special coupon code to get 20% discount off these prices. You can find the coupon code on the Gold Pass page.
Tutorial 98 video
For best results, watch this in full screen HD mode.
This tutorial program is available for immediate download for only $19.95.
Gold Pass members get an additional 20% discount off all program and tutorial prices. If you are a Gold Pass member make sure you enter the special coupon code to get 20% discount off these prices. You can find the coupon code on the Gold Pass page.
ANY EASYLANGUAGE OR POWERLANGUAGE TRADING STRATEGIES, SIGNALS, STUDIES, INDICATORS, SHOWME STUDIES, PAINTBAR STUDIES, PROBABILITYMAP STUDIES, ACTIVITYBAR STUDIES, FUNCTIONS (AND PARTS THEREOF) AND ASSOCIATED TECHNIQUES REFERRED TO, INCLUDED IN OR ATTACHED TO THIS TUTORIAL OR PROGRAM DESCRIPTION ARE EXAMPLES ONLY, AND HAVE BEEN INCLUDED SOLELY FOR EDUCATIONAL PURPOSES. MARKPLEX CORPORATION. DOES NOT RECOMMEND THAT YOU USE ANY SUCH TRADING STRATEGIES, SIGNALS, STUDIES, INDICATORS, SHOWME STUDIES, PAINTBAR STUDIES, PROBABILITYMAP STUDIES, ACTIVITYBAR STUDIES, FUNCTIONS (OR ANY PARTS THEREOF) OR TECHNIQUES. THE USE OF ANY SUCH TRADING STRATEGIES, SIGNALS, STUDIES, INDICATORS, SHOWME STUDIES, PAINTBAR STUDIES, PROBABILITYMAP STUDIES, ACTIVITYBAR STUDIES, FUNCTIONS AND TECHNIQUES DOES NOT GUARANTEE THAT YOU WILL MAKE PROFITS, INCREASE PROFITS, OR MINIMIZE LOSSES.