There are many reasons why you might want a TradeStation EasyLanguage program to print data to an external file on your computer. Tutorial 145 demonstrated how data, only available in real time, could be saved to a file and then read back in to a chart containing historic data.
In tutorial 145 the name of the external was set as an input and only that one file was used. There may be situations, however, where you require a program to create new, uniquely named files whenever a certain event occurs or after a period of time.
Tutorial 195 demonstrates how a program can create multiple files on a local computer and store data in each of them.
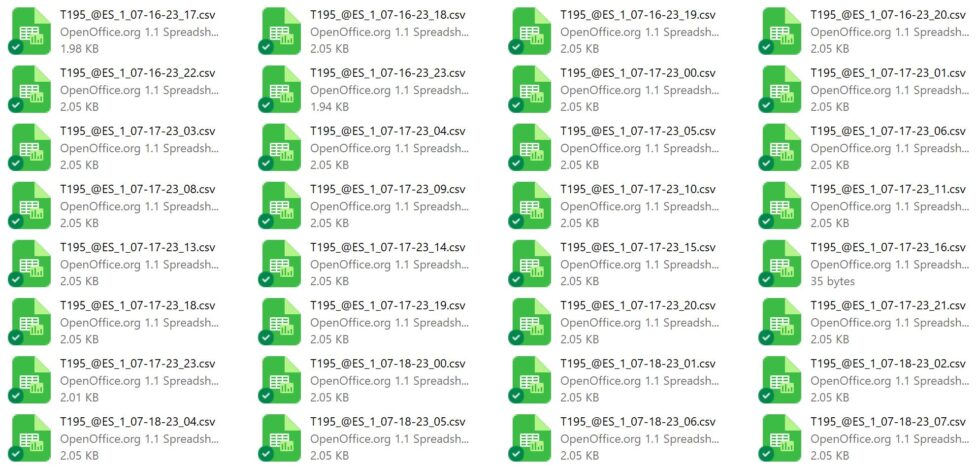
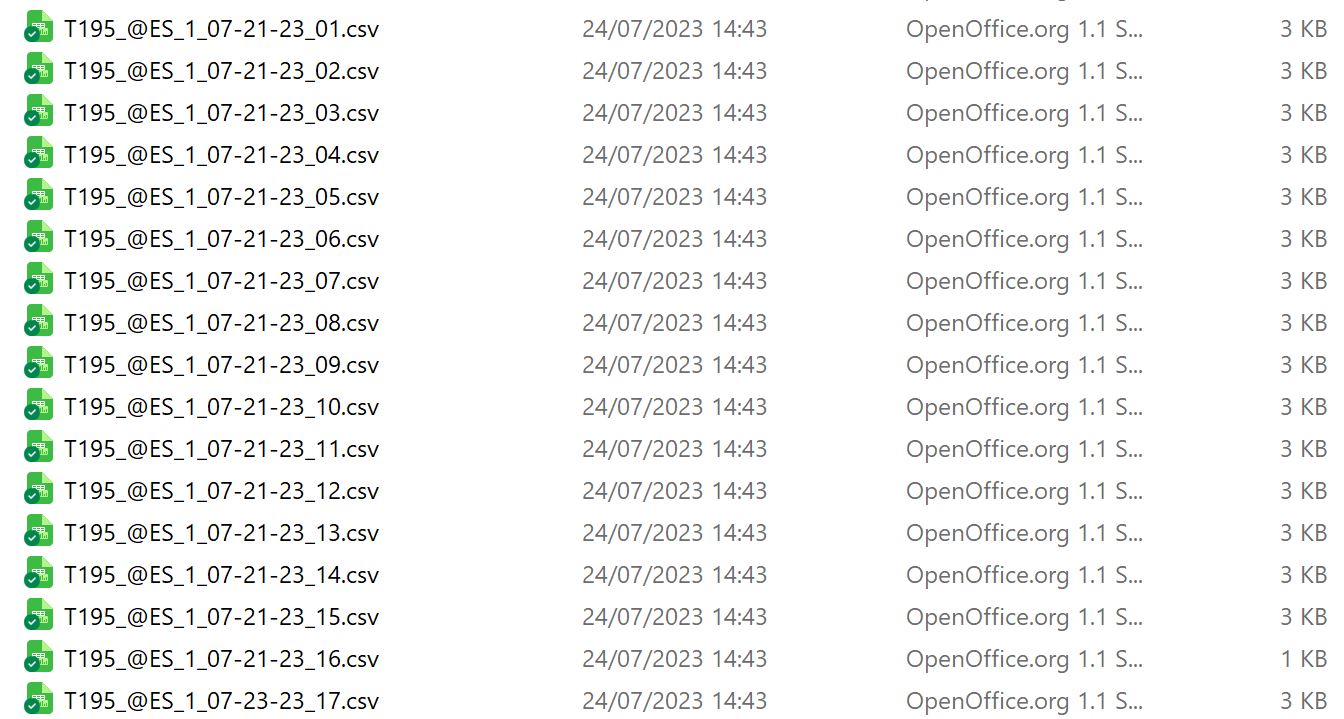
In this example program, applied to a 1 minute chart, exponential moving averages are calculated and then written to a CSV (Comma Separated Value) file. Every time a new hour begins, a new file is created. The files are named using a combination of the symbol name, the bar interval, the date and the hour, for example: “T195_@ES_1_07-16-23_19.csv.”
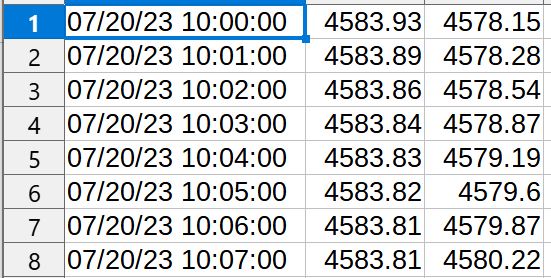
The files are created and the data stored using StreamWriter functionality. In this example we are not using StreamReader to read the data we have stored, rather the data is available to be analyzed in a spreadsheet program.
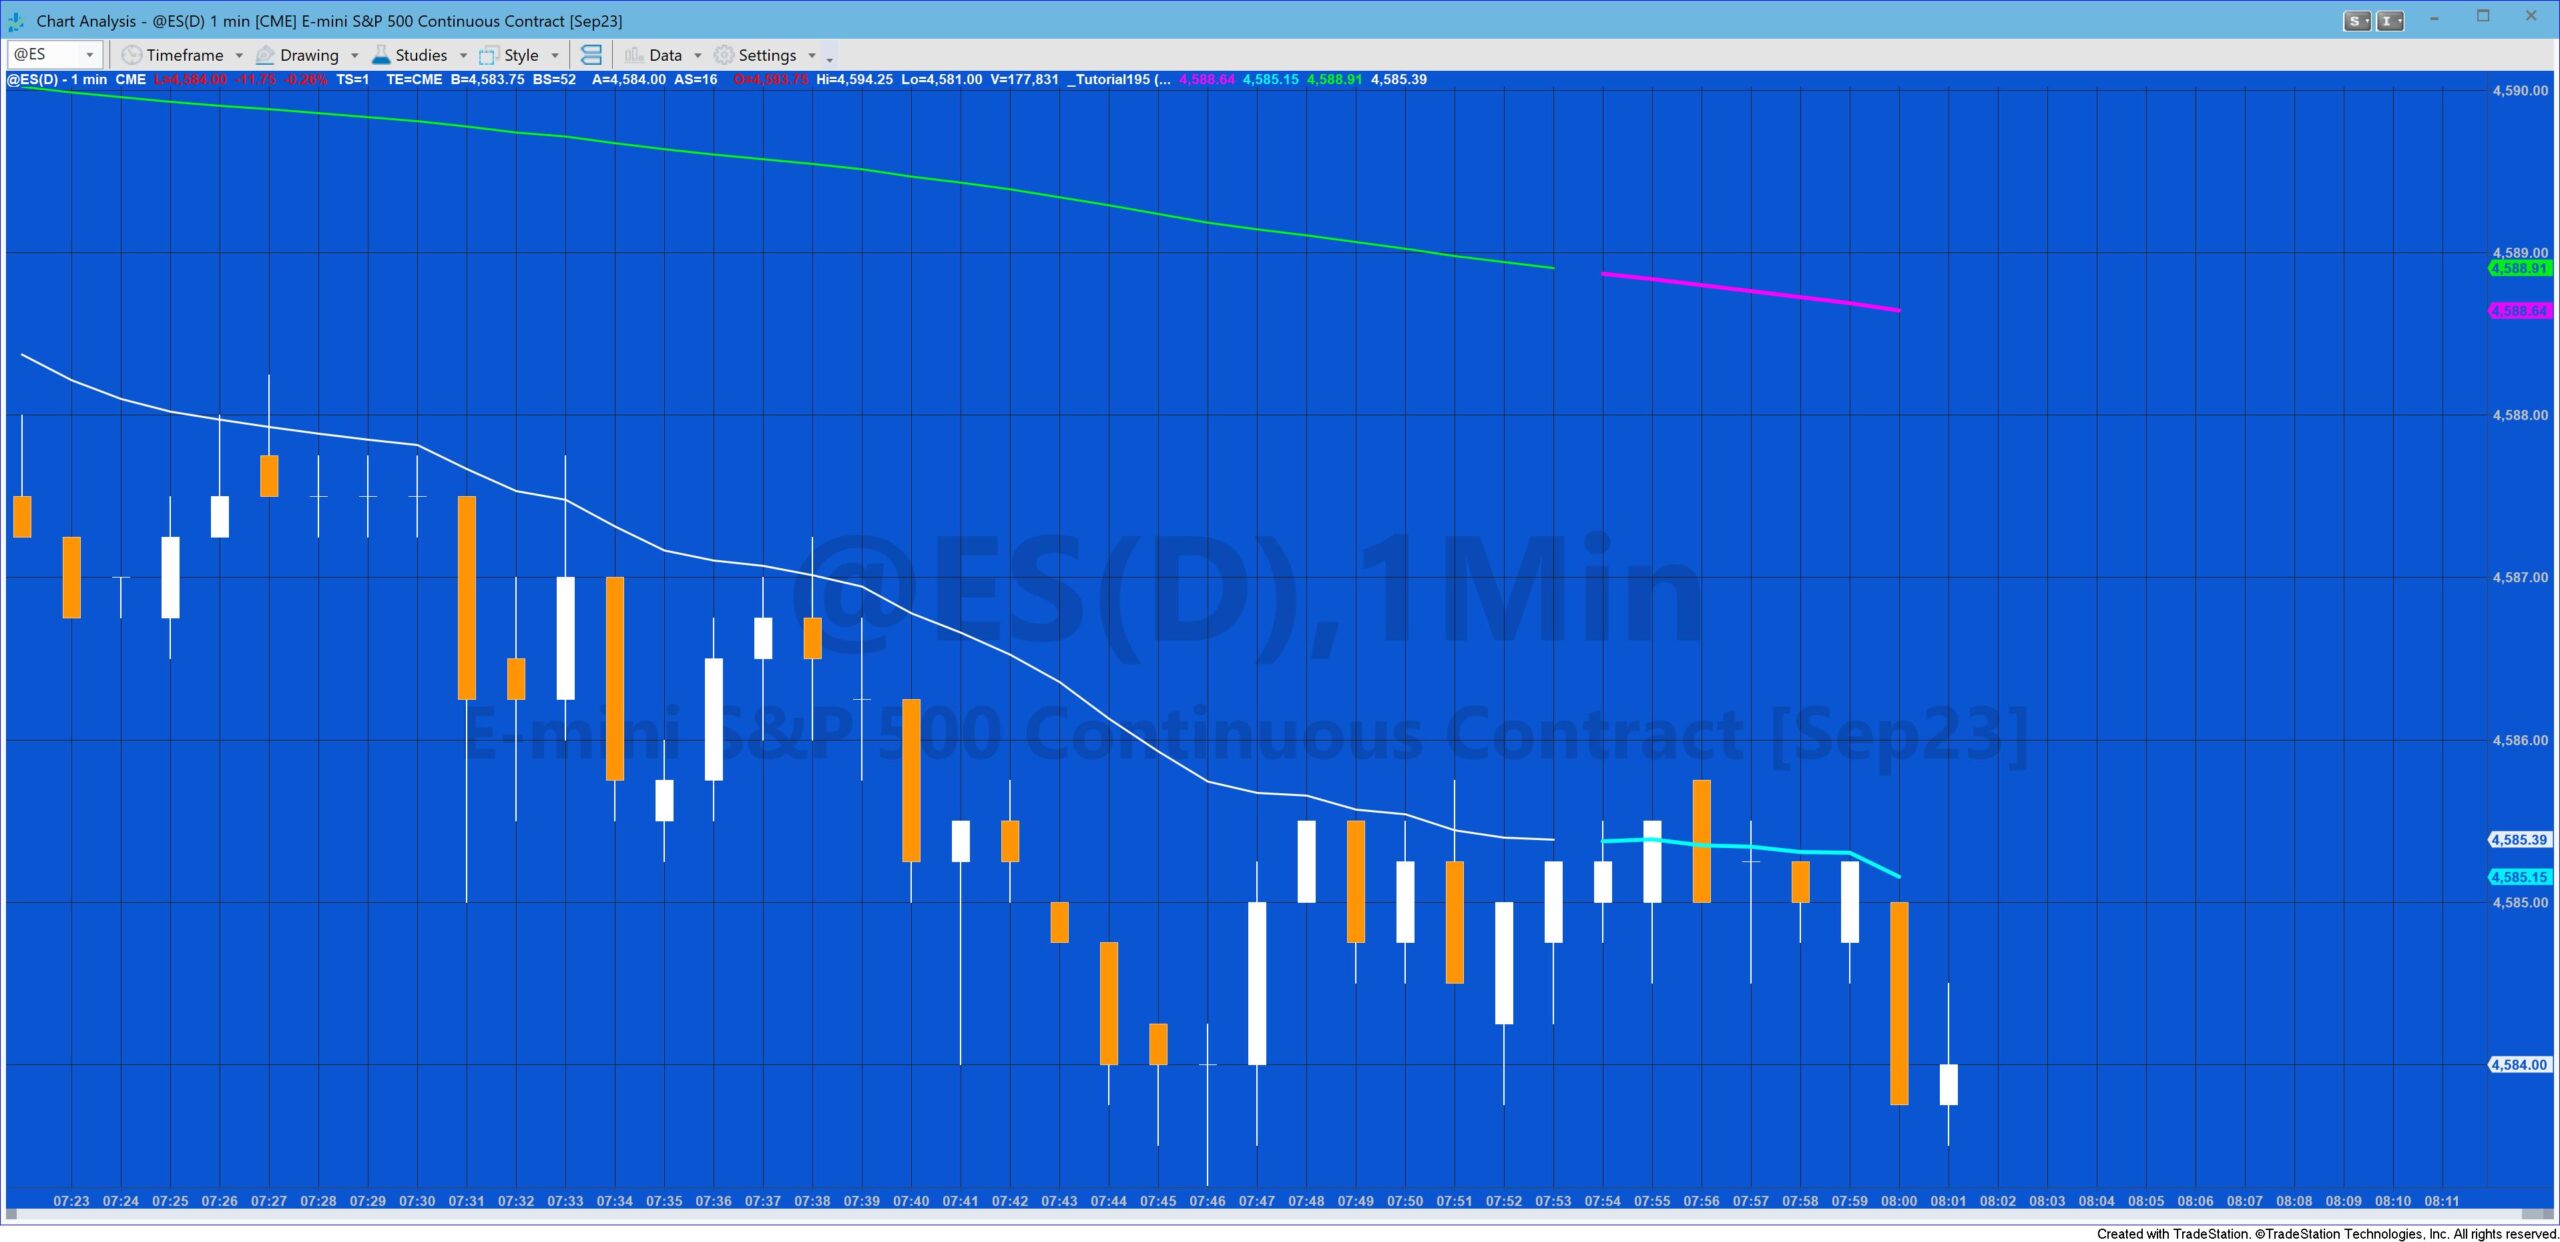
The program plots the exponential moving averages in different colors depending on whether they were calculated for real time or historic bars.
Note: if a file is open in another program (e.g. a spreadsheet) when TradeStation attempts to write to it, a run-time error will occur.
Also see tutorial 145 which covers a similar subject area.


Explanation of tutorial 195
Free Gold Pass download of the tutorial 195 code
If you are a Gold Pass member you can download the tutorial 195 program for free. (Make sure that you are logged into Gold Pass):

TO THE BEST OF MARKPLEX CORPORATION’S KNOWLEDGE, ALL OF THE INFORMATION ON THIS PAGE IS CORRECT, AND IT IS PROVIDED IN THE HOPE THAT IT WILL BE USEFUL. HOWEVER, MARKPLEX CORPORATION ASSUMES NO LIABILITY FOR ANY DAMAGES, DIRECT OR OTHERWISE, RESULTING FROM THE USE OF THIS INFORMATION AND/OR PROGRAM(S) DESCRIBED, AND NO WARRANTY IS MADE REGARDING ITS ACCURACY OR COMPLETENESS. USE OF THIS INFORMATION AND/OR PROGRAMS DESCRIBED IS AT YOUR OWN RISK.
ANY EASYLANGUAGE OR POWERLANGUAGE TRADING STRATEGIES, SIGNALS, STUDIES, INDICATORS, SHOWME STUDIES, PAINTBAR STUDIES, PROBABILITYMAP STUDIES, ACTIVITYBAR STUDIES, FUNCTIONS (AND PARTS THEREOF) AND ASSOCIATED TECHNIQUES REFERRED TO, INCLUDED IN OR ATTACHED TO THIS TUTORIAL OR PROGRAM DESCRIPTION ARE EXAMPLES ONLY, AND HAVE BEEN INCLUDED SOLELY FOR EDUCATIONAL PURPOSES. MARKPLEX CORPORATION. DOES NOT RECOMMEND THAT YOU USE ANY SUCH TRADING STRATEGIES, SIGNALS, STUDIES, INDICATORS, SHOWME STUDIES, PAINTBAR STUDIES, PROBABILITYMAP STUDIES, ACTIVITYBAR STUDIES, FUNCTIONS (OR ANY PARTS THEREOF) OR TECHNIQUES. THE USE OF ANY SUCH TRADING STRATEGIES, SIGNALS, STUDIES, INDICATORS, SHOWME STUDIES, PAINTBAR STUDIES, PROBABILITYMAP STUDIES, ACTIVITYBAR STUDIES, FUNCTIONS AND TECHNIQUES DOES NOT GUARANTEE THAT YOU WILL MAKE PROFITS, INCREASE PROFITS, OR MINIMIZE LOSSES.


