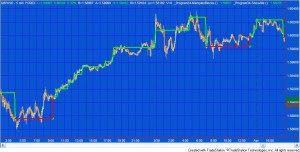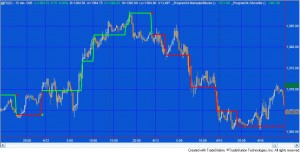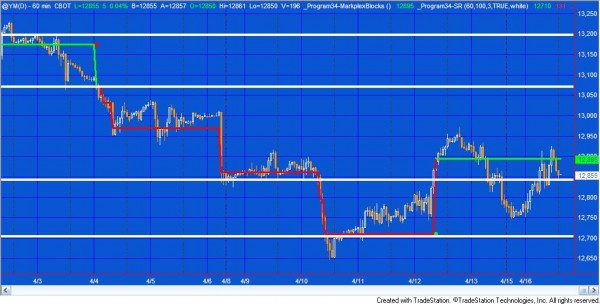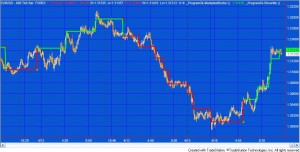
In program 34 I use a technique to attempt to discern market direction by filtering out price ‘noise’ from price action. The program analyses each bar by using a block size based on Average True Range (ATR) and counts how many of these blocks (if any, fit within the bar).
Notice how the price can move away from the lines drawn on the chart.
Program 34 actually consists of three separate programs which are all included in the download below:
- An indicator that plots lines based on the market direction and extremes of the blocks (_Program34-MarkplexBlocks)
- A show me study that plots dots when the direction changes (_Program34-ShowMe)
- A support and resistance show me study that uses the levels where direction changes to attempt to ascertain levels of support and resistance (_Program34-SR). See the video below for an explanation.
The support and resistance show me study works by comparing the levels where price turns with previous levels. If price has turned at a specific level on several previous occasions the level is given a greater ‘weighting’ and appears thicker on the chart (up to a maximum thickness of three).

All three UNPROTECTED programs (i.e. the TradeStation EasyLanguage indicator and two show me studies) DEVELOPED IN VERSION 9.0 are available for immediate download for $145.95. I have included plain text versions of the programs as well as the ELD. Click the ‘add to cart’ button to pay using Credit card or PayPal. Gold Pass members are eligible for 20% off this price when they type in their special discount code (see //markplex.com/gold-pass-content/ to get the latest code).

Using the support and resistance program

In order to get potentially useful results from _Program34-SR it is important to understand and adjust the user inputs. It is also advisable to load a fairly large number of bars to start with, The user inputs for this program are as follows:
NumberTurningPoints( 60), // The number of TurningPoints to be stored in the array at any one time (maximum is 500)
CombineVal( 5), // How close a new pivot has to be to one stored in the array for the 2 to be combined – expressed as multiple of minimum price move
LineSensitivity( 8), // If ShowCombLines is set to TRUE this determines that only lines with this weighting or above are extended to the right
ShowCombLines( TRUE), // If set to TRUE combined pivot lines are displayed
CombineCol( DarkRed); // Combined pivot line color
I suggest that you start with a high value of NumberTurningPoints. This determines how many turning points are stored in the array with a maximum of 500.
The CombineVal determines how close lines should be before they are merged. It is expressed, in this program, as a multiple of the minimum price move (or ‘tick’ value). Chose a sensible value that is not too big or too small.
LineSensitivity extends lines that have been ‘combined’ with others this number or greater times. For example, if it is set to 3, the program will only extend lines to the right that have been merged three or more times. I suggest you start with a low value and gradually increase it the filter out level lines.
If ShowCombLines is set to true, the combined lines are drawn on the chart.
CombineCol determines the color of the combined lines. Make sure that you chose a color that contrasts with the background color of the chart,
I demonstrate how to set this program up in the video below.
All three UNPROTECTED programs (i.e. the TradeStation EasyLanguage indicator and two show me studies) DEVELOPED IN VERSION 9.0 are available for immediate download for $145.95. I have included plain text versions of the programs as well as the ELD. Click the ‘add to cart’ button to pay using Credit card or PayPal. Gold Pass members are eligible for 20% off this price when they type in their special discount code (see //markplex.com/gold-pass-content/ to get the latest code).
Program 34 video
TO THE BEST OF MARKPLEX CORPORATION’S KNOWLEDGE, ALL OF THE INFORMATION ON THIS PAGE IS CORRECT, AND IT IS PROVIDED IN THE HOPE THAT IT WILL BE USEFUL. HOWEVER, MARKPLEX CORPORATION ASSUMES NO LIABILITY FOR ANY DAMAGES, DIRECT OR OTHERWISE, RESULTING FROM THE USE OF THIS INFORMATION AND/OR PROGRAM(S) DESCRIBED, AND NO WARRANTY IS MADE REGARDING ITS ACCURACY OR COMPLETENESS. USE OF THIS INFORMATION AND/OR PROGRAMS DESCRIBED IS AT YOUR OWN RISK.
ANY EASYLANGUAGE OR POWERLANGUAGE TRADING STRATEGIES, SIGNALS, STUDIES, INDICATORS, SHOWME STUDIES, PAINTBAR STUDIES, PROBABILITYMAP STUDIES, ACTIVITYBAR STUDIES, FUNCTIONS (AND PARTS THEREOF) AND ASSOCIATED TECHNIQUES REFERRED TO, INCLUDED IN OR ATTACHED TO THIS TUTORIAL OR PROGRAM DESCRIPTION ARE EXAMPLES ONLY, AND HAVE BEEN INCLUDED SOLELY FOR EDUCATIONAL PURPOSES. MARKPLEX CORPORATION. DOES NOT RECOMMEND THAT YOU USE ANY SUCH TRADING STRATEGIES, SIGNALS, STUDIES, INDICATORS, SHOWME STUDIES, PAINTBAR STUDIES, PROBABILITYMAP STUDIES, ACTIVITYBAR STUDIES, FUNCTIONS (OR ANY PARTS THEREOF) OR TECHNIQUES. THE USE OF ANY SUCH TRADING STRATEGIES, SIGNALS, STUDIES, INDICATORS, SHOWME STUDIES, PAINTBAR STUDIES, PROBABILITYMAP STUDIES, ACTIVITYBAR STUDIES, FUNCTIONS AND TECHNIQUES DOES NOT GUARANTEE THAT YOU WILL MAKE PROFITS, INCREASE PROFITS, OR MINIMIZE LOSSES.

