
Overview of line break strategy
In tutorial 23 I created a program that simulated lines on a line break chart (such as a three line break chart). This strategy uses the techniques developed in tutorial 23 and program 3 to go long using a market order after a new set of ‘up’ lines begins and goes short using a market order after a new set of down lines begins.
Once in a trade the program has two targets which are user inputs. The targets are expressed as multiple of minimum price move (i.e. Target1 = Tgt1 * MinMove / PriceScale). The second target is incremental to the first target (i.e. Target2 = Tgt2 * MinMove / PriceScale + Target1). A LIMIT order to exit a user inputnumber of contracts (FirstTgtCts) is set at Target1 and another LIMIT order is set at Target2.
The program also sets a trailing stop whose value is adjusted. Trailingstop orders are made using STOP orders.
User defined options are available to draw the target and trailing stop levels on the chart. If SHOWLINES input is set to FALSE, only today’s targets and trailing stops are shown. If set to TRUE then historical targets and trailing stops are also shown.
To help you develop the strategy further I have added several filters in the program that you can modify to filter out trades based on your trading techniques. By default each filter is set to TRUE, but for example, if you only wanted to enter long trades when FastK( 14 ) was less than 20, you would edit the program and change:
FilterL1 = TRUE ;
to
FilterL1 = FastK( 14 ) < 20;
The video below explains in more detail how the program works and what the various inputs mean. Please be sure to watch it AND READ THE FOLLOWING DISCLAIMER before buying the program.
TO THE BEST OF MARKPLEX CORPORATION’S KNOWLEDGE, ALL OF THE INFORMATION ON THIS PAGE IS CORRECT, AND IT IS PROVIDED IN THE HOPE THAT IT WILL BE USEFUL. HOWEVER, MARKPLEX CORPORATION ASSUMES NO LIABILITY FOR ANY DAMAGES, DIRECT OR OTHERWISE, RESULTING FROM THE USE OF THIS INFORMATION AND/OR PROGRAM(S) DESCRIBED, AND NO WARRANTY IS MADE REGARDING ITS ACCURACY OR COMPLETENESS. USE OF THIS INFORMATION AND/OR PROGRAMS DESCRIBED IS AT YOUR OWN RISK.
ANY EASYLANGUAGE OR POWERLANGUAGE TRADING STRATEGIES, SIGNALS, STUDIES, INDICATORS, SHOWME STUDIES, PAINTBAR STUDIES, PROBABILITYMAP STUDIES, ACTIVITYBAR STUDIES, FUNCTIONS (AND PARTS THEREOF) AND ASSOCIATED TECHNIQUES REFERRED TO, INCLUDED IN OR ATTACHED TO THIS TUTORIAL OR PROGRAM DESCRIPTION ARE EXAMPLES ONLY, AND HAVE BEEN INCLUDED SOLELY FOR EDUCATIONAL PURPOSES. MARKPLEX CORPORATION. DOES NOT RECOMMEND THAT YOU USE ANY SUCH TRADING STRATEGIES, SIGNALS, STUDIES, INDICATORS, SHOWME STUDIES, PAINTBAR STUDIES, PROBABILITYMAP STUDIES, ACTIVITYBAR STUDIES, FUNCTIONS (OR ANY PARTS THEREOF) OR TECHNIQUES. THE USE OF ANY SUCH TRADING STRATEGIES, SIGNALS, STUDIES, INDICATORS, SHOWME STUDIES, PAINTBAR STUDIES, PROBABILITYMAP STUDIES, ACTIVITYBAR STUDIES, FUNCTIONS AND TECHNIQUES DOES NOT GUARANTEE THAT YOU WILL MAKE PROFITS, INCREASE PROFITS, OR MINIMIZE LOSSES.
This unprotected and commented program (i.e. the TradeStation EasyLanguage strategy) is available for immediate download for $94.95 by clicking here to pay using PayPal or credit card:
The program works with versions 8.7 and above, including TradeStation version 9.1, 9.5 and 10.
If you are also interested in program 3 and tutorial 23, a bundle of all three products (programs 3 and 5, together with tutorial 23) for $114.95. This is a 20% discount off the price of buying all three products separately. Click the following link to pay with PayPal or credit card:
As always, Gold Pass members are eligible for a 20% discount off these prices.
This strategy combines the functionality developed in tutorial 23 – creating a 3 line break (3LB) indicator to apply to normal candlestick charts and program 3 – three line break show-me study. You may find that the information in these two links is useful and the programs that can be downloaded there may also be good companion programs to go with this one.
The following chart shows the strategy applied to a 5 minute GBPUSD chart. None of the filters are activated.
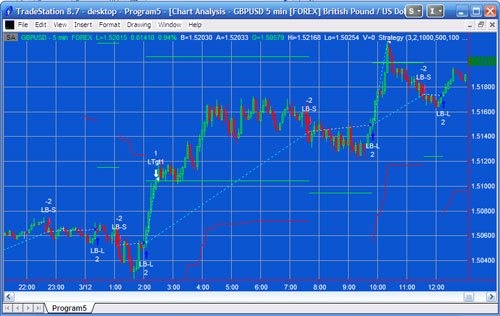
The horizontal green lines represent the two targets. The red line represents the trailing stop. As you can see, for a long trade, it is adjusted upward as price rises and for a short trade, it is adjusted downwards as price decreases. The target and trailing stop values can be set as inputs.
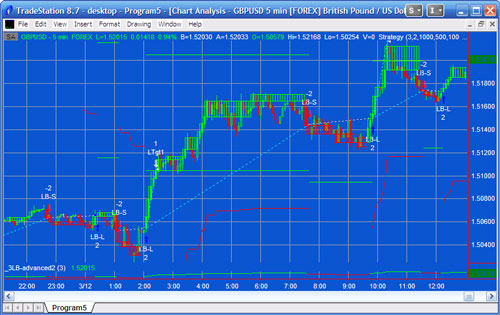
The following chart shows this strategy applied to a chart, together with the line break indicator developed in tutorial 23
This unprotected and commented program (i.e. the TradeStation EasyLanguage strategy) is available for immediate download for $94.95 by clicking here to pay using PayPal or credit card:
The program works with versions 8.7 and above, including TradeStation version 9.1, 9.5 and 10.0.
If you are also interested in program 3 and tutorial 23, a bundle of all three products (programs 3 and 5, together with tutorial 23) for $114.95. This is a 20% discount off the price of buying all three products separately. Click the following link to pay with PayPal or credit card:
As always, Gold Pass members are eligible for a 20% discount off these prices.
The following video explains the use of this program in more detail. I would also suggest that you view the videos included with tutorial 23 and program 2 to more fully understand the functionality in this program.
The program was developed in TradeStation 8.7 and has been tested on intraday and daily charts.
Video demonstration of program 5 – line break strategy
Program inputs
NumBarsBreak( 3 ), // Number of lines that need to broken for chnage in direction (e.g. 3 line break)
Cts( 10 ), // Number of contracts
TrailVal( 100 ), // Trail value – expressed as mulitple of minimum price move
Tgt1( 100 ), // First target – expressed as multiple of minimum price move (i.e. Target1 = Tgt1 * MinMove / PriceScale)
Tgt2( 200 ), // Second target – incremental to the first target (i.e. Target2 = Tgt2 * MinMove / PriceScale + Traget1)
FirstTgtCts( 5 ), // The number of contracts to be taken off at first target
ShowLines( TRUE ); If set to TRUE historical target and trailing stop lines are drawn – if false just today’s lines
N.B. The results that you receive from program 5 will depend on the inputs you provide and the filters that you create
This unprotected and commented program (i.e. the TradeStation EasyLanguage strategy) is available for immediate download for $94.95 by clicking here to pay using PayPal or credit card:
The program works with versions 8.7 and above, including TradeStation version 9.1.
If you are also interested in program 3 and tutorial 23, a bundle of all three products (programs 3 and 5, together with tutorial 23) for $114.95. This is a 20% discount off the price of buying all three products separately. Click the following link to pay with PayPal or credit card:
As always, Gold Pass members are eligible for a 20% discount off these prices.
If you would prefer to pay be check, please make a check payable to Billy Fire LLC and mail to 14781 Pomerado Road, #110, Poway CA 92064 together with a valid email address. I will email download instructions to you.
The program is ‘unprotected,’ in other words, you will be able to see and edit the program.
Please email any bugs that you may discover to support@markplex.com.
TO THE BEST OF MARKPLEX CORPORATION’S KNOWLEDGE, ALL OF THE INFORMATION ON THIS PAGE IS CORRECT, AND IT IS PROVIDED IN THE HOPE THAT IT WILL BE USEFUL. HOWEVER, MARKPLEX CORPORATION ASSUMES NO LIABILITY FOR ANY DAMAGES, DIRECT OR OTHERWISE, RESULTING FROM THE USE OF THIS INFORMATION AND/OR PROGRAM(S) DESCRIBED, AND NO WARRANTY IS MADE REGARDING ITS ACCURACY OR COMPLETENESS. USE OF THIS INFORMATION AND/OR PROGRAMS DESCRIBED IS AT YOUR OWN RISK.
ANY EASYLANGUAGE OR POWERLANGUAGE TRADING STRATEGIES, SIGNALS, STUDIES, INDICATORS, SHOWME STUDIES, PAINTBAR STUDIES, PROBABILITYMAP STUDIES, ACTIVITYBAR STUDIES, FUNCTIONS (AND PARTS THEREOF) AND ASSOCIATED TECHNIQUES REFERRED TO, INCLUDED IN OR ATTACHED TO THIS TUTORIAL OR PROGRAM DESCRIPTION ARE EXAMPLES ONLY, AND HAVE BEEN INCLUDED SOLELY FOR EDUCATIONAL PURPOSES. MARKPLEX CORPORATION. DOES NOT RECOMMEND THAT YOU USE ANY SUCH TRADING STRATEGIES, SIGNALS, STUDIES, INDICATORS, SHOWME STUDIES, PAINTBAR STUDIES, PROBABILITYMAP STUDIES, ACTIVITYBAR STUDIES, FUNCTIONS (OR ANY PARTS THEREOF) OR TECHNIQUES. THE USE OF ANY SUCH TRADING STRATEGIES, SIGNALS, STUDIES, INDICATORS, SHOWME STUDIES, PAINTBAR STUDIES, PROBABILITYMAP STUDIES, ACTIVITYBAR STUDIES, FUNCTIONS AND TECHNIQUES DOES NOT GUARANTEE THAT YOU WILL MAKE PROFITS, INCREASE PROFITS, OR MINIMIZE LOSSES.