
Bollinger band constrictions and Keltner crosses
As was mentioned in tutorial 98, a narrowing of the Bollinger bands is an indication of lower volatility. According to John Bollinger (who created the Bollinger band concept), periods of low volatility are often followed by periods of high volatility. This could mean that a narrowing of the Bollinger bands (or a period of low volatility) –a ‘squeeze’–may foreshadow a period of higher volatility, or a breakout in price.
Another way of looking at expansion of volatility is when the Bollinger bands cross outside a Keltner channel.
Program 59 searched for both constriction in the height of the Bollinger band and where the Bollinger bands move outside the Keltner channel. It actually includes two programs:
- _Program59 (an indicator)
- _Program59 PB ( a paintbar study)
_Program59
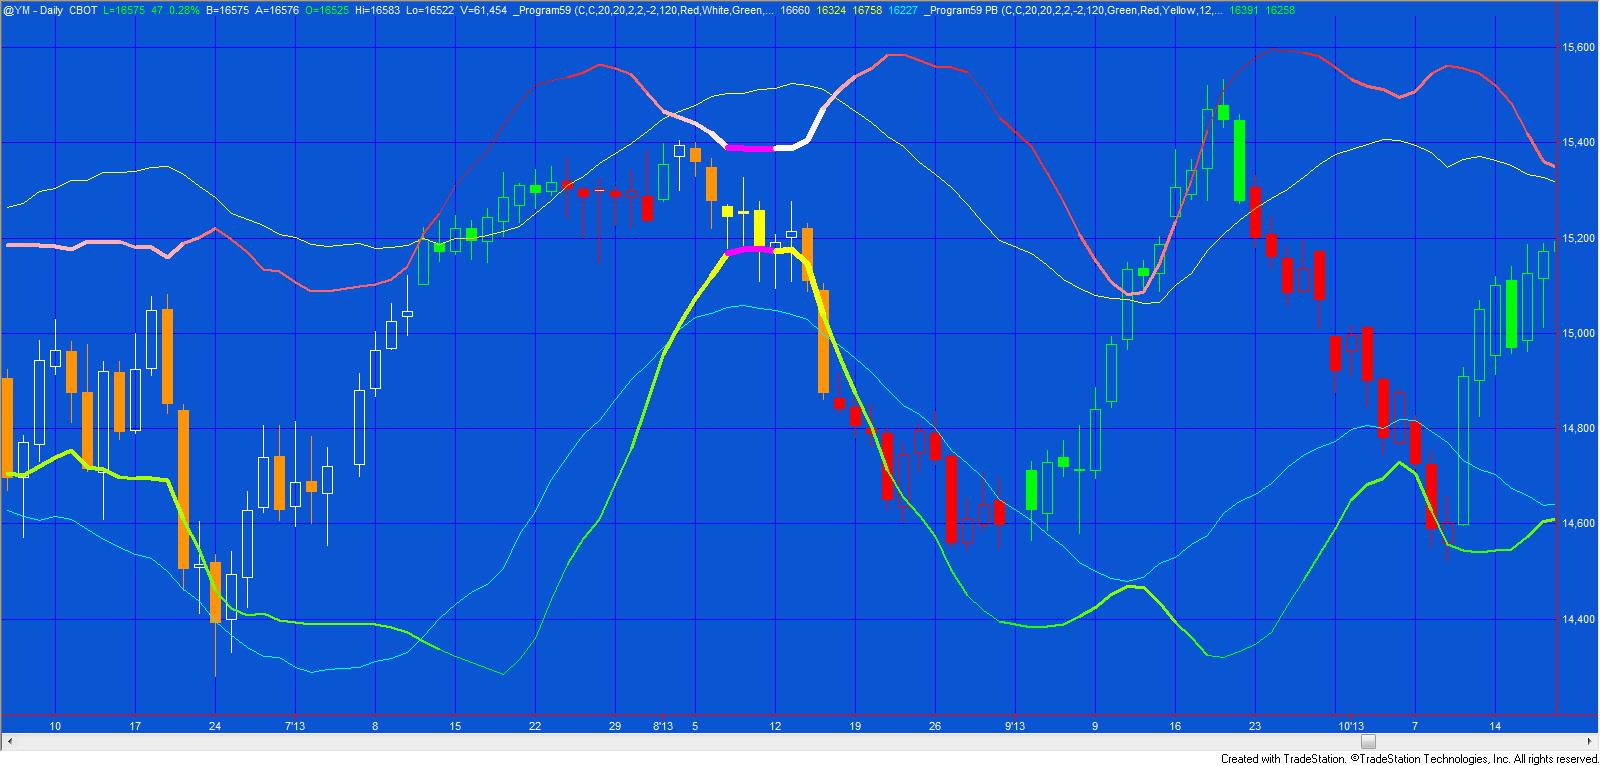
_Program59 is a TradeStation indicator, written in EasyLanguage. It plots upper and lower Bollinger bands (and the average if a user input is set to true). When a ‘squeeze’ occurs (i.e. when the height of the Bollinger band is less than or equal to the height of a user defined number of bars, in this case the default is set to 120 bars) the upper and lower bands are plotted in a user input color (magenta in the image above). In order to give a quick visual indication to the user, the bands are also colored on a gradient between two user input colors and their thickness modified depending on the height of the Bollinger bands over a user input number of bars. See the video below for an explanation.
_Program59 also includes an alert when a ‘squeeze’ is identified and when the upper Bollinger crosses above the upper Keltner channel or when the lower Bollinger band crosses below the lower Keltner channel.
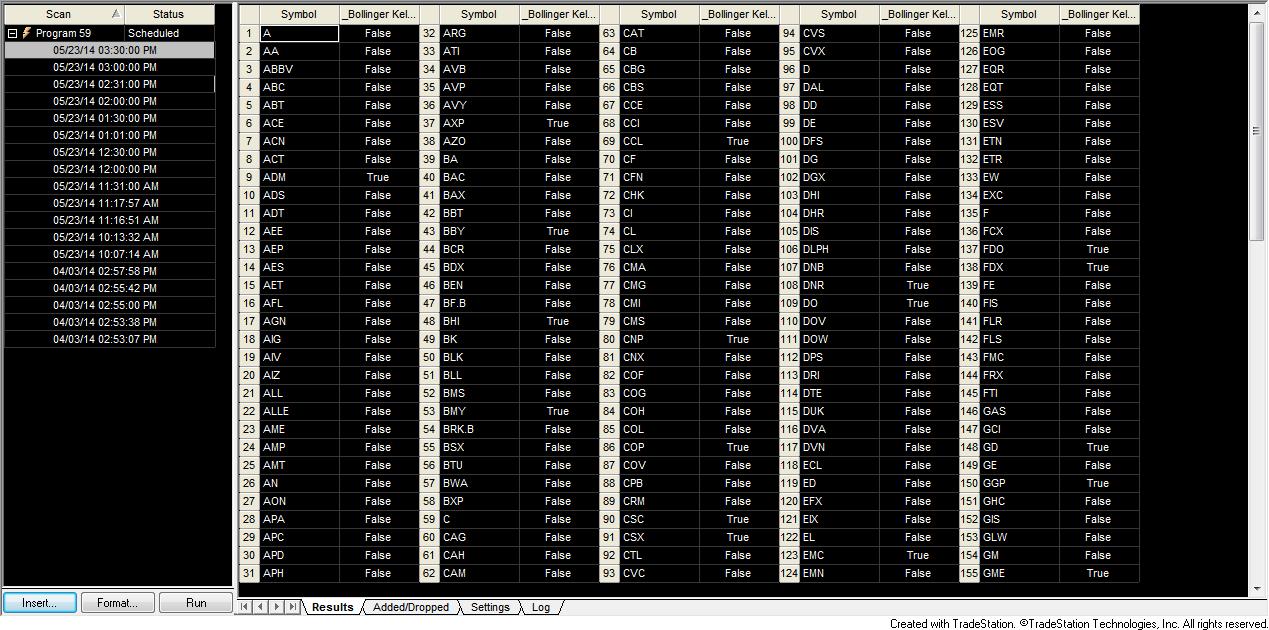
The program may used with the TradeStation scanner to identify squeeze patterns or when Bollinger crosses above the upper Keltner channel or when the lower Bollinger band crosses below the lower Keltner channel. I demonstrate this in the video below.
Inputs and default values
BollingerPrice( C ), // Price to be used in the Bollinger calculation
KeltnerPrice( C ), // Price using in Keltner channel calculation
BollingerLength( 20 ), // Length used in Bollinger calculation
KeltnerLength( 20 ), // Length used in keltner calculation
NumATRs( 2 ), // Used in the Keltner calculation
NumDevsUp( 2 ), // Used in the Bollinger calculation
NumDevsDn( -2 ), // Used in the Bollinger calculation
NumBars( 120 ), // The number of bars used to confirm Bollinger squeeze and to calculate thickness and color of lines
AboveColor1( Red ), // As Bollinger height increases upper lines become more this color
AboveColor2( White ), // As Bollinger height decreases upper lines become more this color
BelowColor1( Green ), // As Bollinger height increases lower lines become more this color
BelowColor2( Yellow ), // As Bollinger height decreases lower lines become more this color
SqueezeColor( Magenta ), // Color used to highlight ‘squeeze’ pattern
AboveWidth( 3 ), // Used the calculate the thickness of the upper Bollinger line, this being the maximum thickness when the lines are close
BelowWidth( 3 ), // Used the calculate the thickness of the lower Bollinger line, this being the maximum thickness when the lines are close
MaxWidth( 4 ), // Width of lines in the squeeze pattern
ShowAvg( True ); // If TRUE the Bollinger average is plotted
_Program59 PB
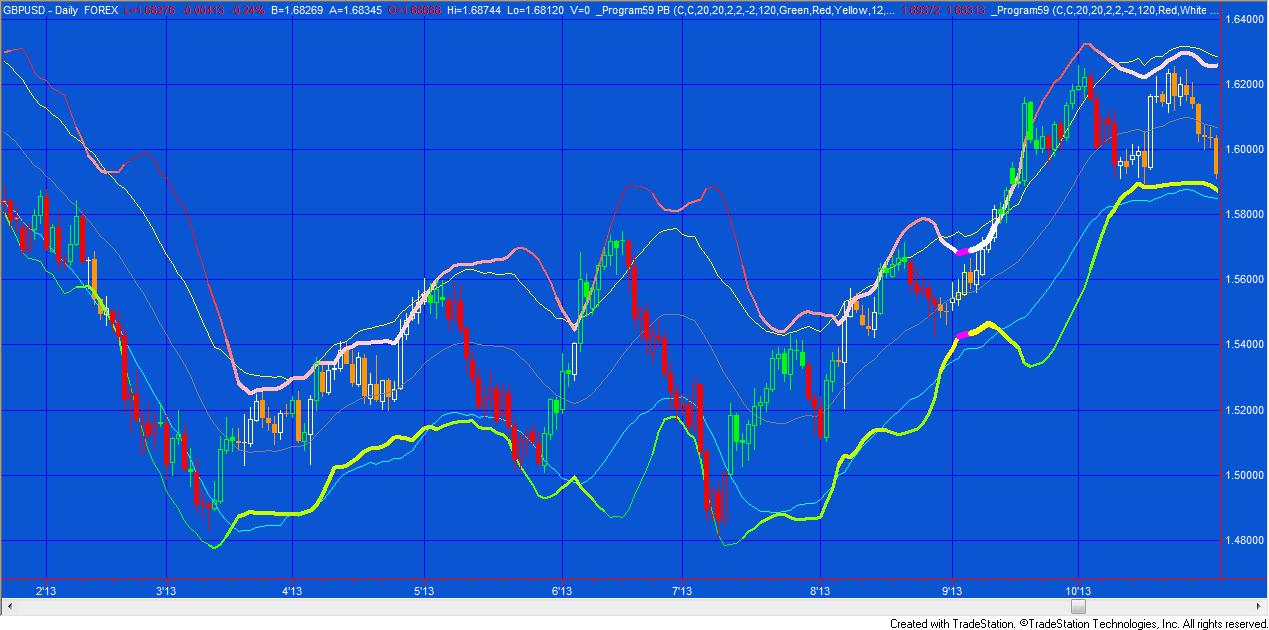
_Program59 PB paints bars as follows:
- When the upper Bollinger band is above the upper Keltner channel line and the slope of the MACD is up, bars are colored according to are the AboveColor1 user input.
- When the lower Bollinger band is below the lower Keltner channel line and the slope of the MACD is down, bars are colored according to are the BelowColor1 user input.
- When the height of the Bollinger band is the smallest in the last NumBars bars the bars are colored according to the SqueezeColor user input.
Inputs and default values
BollingerPrice( C ), // Price to be used in the Bollinger calculation
KeltnerPrice( C ), // Priced using in Keltner channel calculation
BollingerLength( 20 ), // Length used in Bollinger calculation
KeltnerLength( 20 ), // Length used in Keltner calculation
NumATRs( 2 ), // Used in the Keltner calculation
NumDevsUp( 2 ), // Used in the Bollinger calculation
NumDevsDn( -2 ), // Used in the Bollinger calculation
NumBars( 120 ), // The number of bars used to confirm Bollinger squeeze and to calculate thickness and color of lines
AboveColor1( Green ), // If Bollinger upper line above Keltner upper line or Bollinger lower line below Keltner lower line and slope of MACD is up, color bars this color
BelowColor1( Red ), // If Bollinger upper line above Keltner upper line or Bollinger lower line below Keltner lower line and slope of MACD is down, color bars this color
SqueezeColor( Yellow ), // If Bollinger squeeze, color bars this color
FastLength( 12 ), // Input for MACD calculation
SlowLength( 26 ), // Input for MACD calculation
MACDLength( 9 ); // Input for MACD calculation
An unprotected copy of program 59 (including the indicator and paintbar study) is available for immediate download for $39.95.
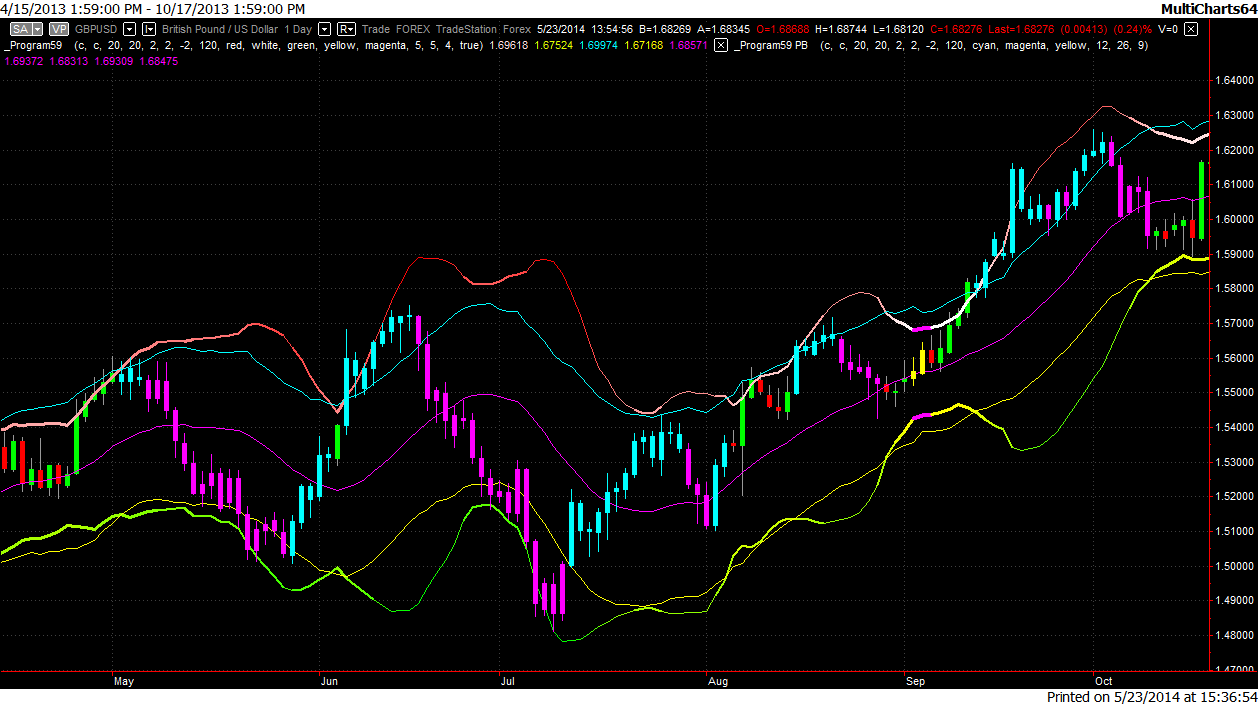
The download includes a TradeStation ELD file (containing the indicator and paintbar study), and a MultiCharts PLA file (containing the indicator and paintbar study).
Gold Pass members get an additional 20% discount off all program and tutorial prices. If you are a Gold Pass member make sure you enter the special coupon code to get 20% discount off these prices. You can find the coupon code on the Gold Pass page.
In case you have not downloaded a program from Markplex before, I have recorded a short video that demonstrates how to use the Markplex.com shopping cart to immediately download a program and import it into TradeStation.
Video of program 59
An unprotected copy of program 59 (including the indicator and paintbar study) is available for immediate download for $39.95.
The download includes a TradeStation ELD file (containing the indicator and paintbar study), and a MultiCharts PLA file (containing the indicator and paintbar study).
Gold Pass members get an additional 20% discount off all program and tutorial prices. If you are a Gold Pass member make sure you enter the special coupon code to get 20% discount off these prices. You can find the coupon code on the Gold Pass page.
I have recorded a short video that demonstrates how to use the Markplex.com shopping cart to immediately download a program and import it into TradeStation.
Gold Pass members get an additional 20% discount off all program and tutorial prices. If you are a Gold Pass member make sure you enter the special coupon code to get 20% discount off these prices. You can find the coupon code on the Gold Pass page.
Please note that any screen shots on this site are examples and are not meant to imply that any of these programs will generate profitable trades. THESE INDICATORS, SHOW ME STUDIES, STRATEGIES AND OTHER PROGRAMS HAVE BEEN INCLUDED SOLELY FOR EDUCATIONAL PURPOSES.
TO THE BEST OF MARKPLEX CORPORATION’S KNOWLEDGE, ALL OF THE INFORMATION ON THIS PAGE IS CORRECT, AND IT IS PROVIDED IN THE HOPE THAT IT WILL BE USEFUL. HOWEVER, MARKPLEX CORPORATION ASSUMES NO LIABILITY FOR ANY DAMAGES, DIRECT OR OTHERWISE, RESULTING FROM THE USE OF THIS INFORMATION AND/OR PROGRAM(S) DESCRIBED, AND NO WARRANTY IS MADE REGARDING ITS ACCURACY OR COMPLETENESS. USE OF THIS INFORMATION AND/OR PROGRAMS DESCRIBED IS AT YOUR OWN RISK.
ANY EASYLANGUAGE OR POWERLANGUAGE TRADING STRATEGIES, SIGNALS, STUDIES, INDICATORS, SHOWME STUDIES, PAINTBAR STUDIES, PROBABILITYMAP STUDIES, ACTIVITYBAR STUDIES, FUNCTIONS (AND PARTS THEREOF) AND ASSOCIATED TECHNIQUES REFERRED TO, INCLUDED IN OR ATTACHED TO THIS TUTORIAL OR PROGRAM DESCRIPTION ARE EXAMPLES ONLY, AND HAVE BEEN INCLUDED SOLELY FOR EDUCATIONAL PURPOSES. MARKPLEX CORPORATION. DOES NOT RECOMMEND THAT YOU USE ANY SUCH TRADING STRATEGIES, SIGNALS, STUDIES, INDICATORS, SHOWME STUDIES, PAINTBAR STUDIES, PROBABILITYMAP STUDIES, ACTIVITYBAR STUDIES, FUNCTIONS (OR ANY PARTS THEREOF) OR TECHNIQUES. THE USE OF ANY SUCH TRADING STRATEGIES, SIGNALS, STUDIES, INDICATORS, SHOWME STUDIES, PAINTBAR STUDIES, PROBABILITYMAP STUDIES, ACTIVITYBAR STUDIES, FUNCTIONS AND TECHNIQUES DOES NOT GUARANTEE THAT YOU WILL MAKE PROFITS, INCREASE PROFITS, OR MINIMIZE LOSSES.