
Oscillator divergence
Click on any of the following images to see bigger versions.
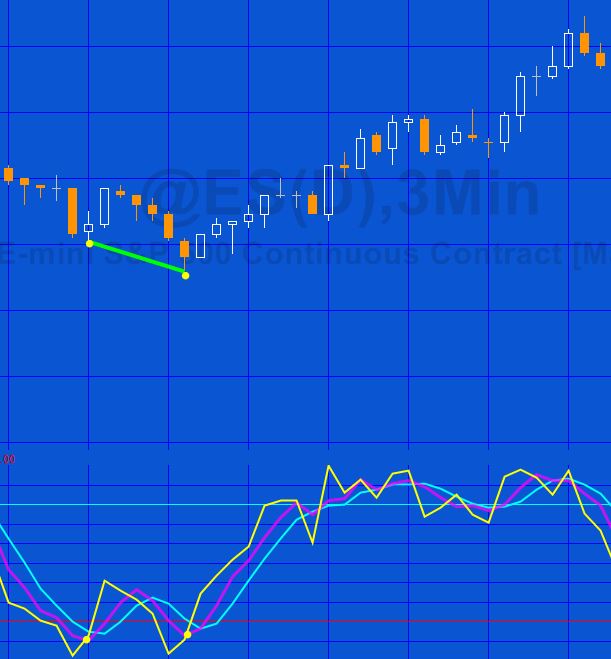
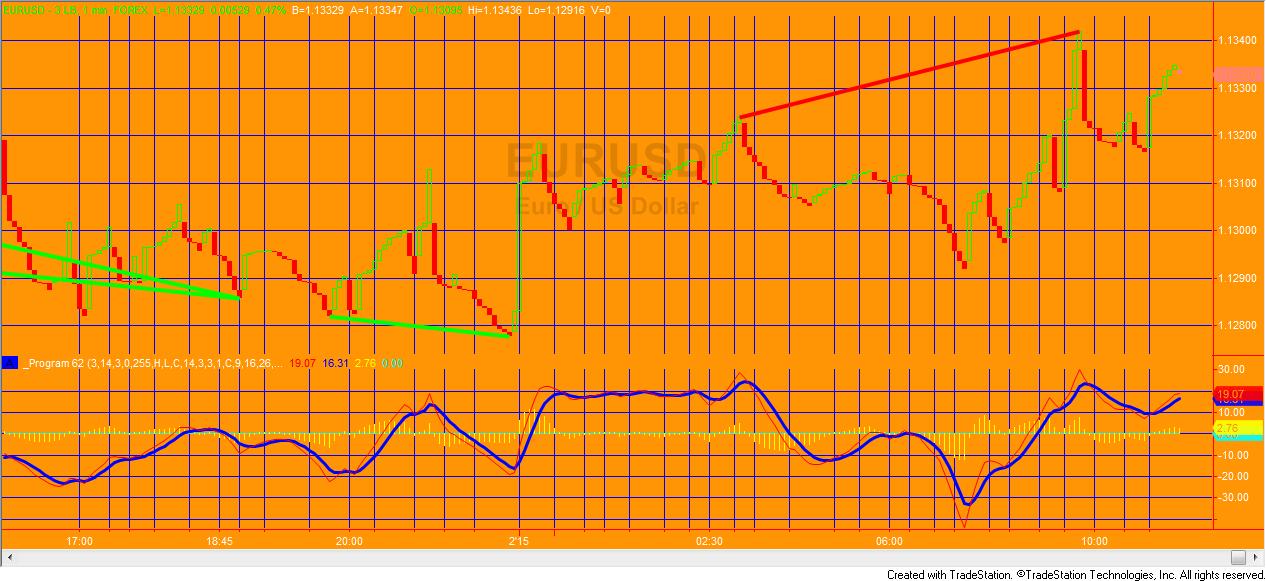
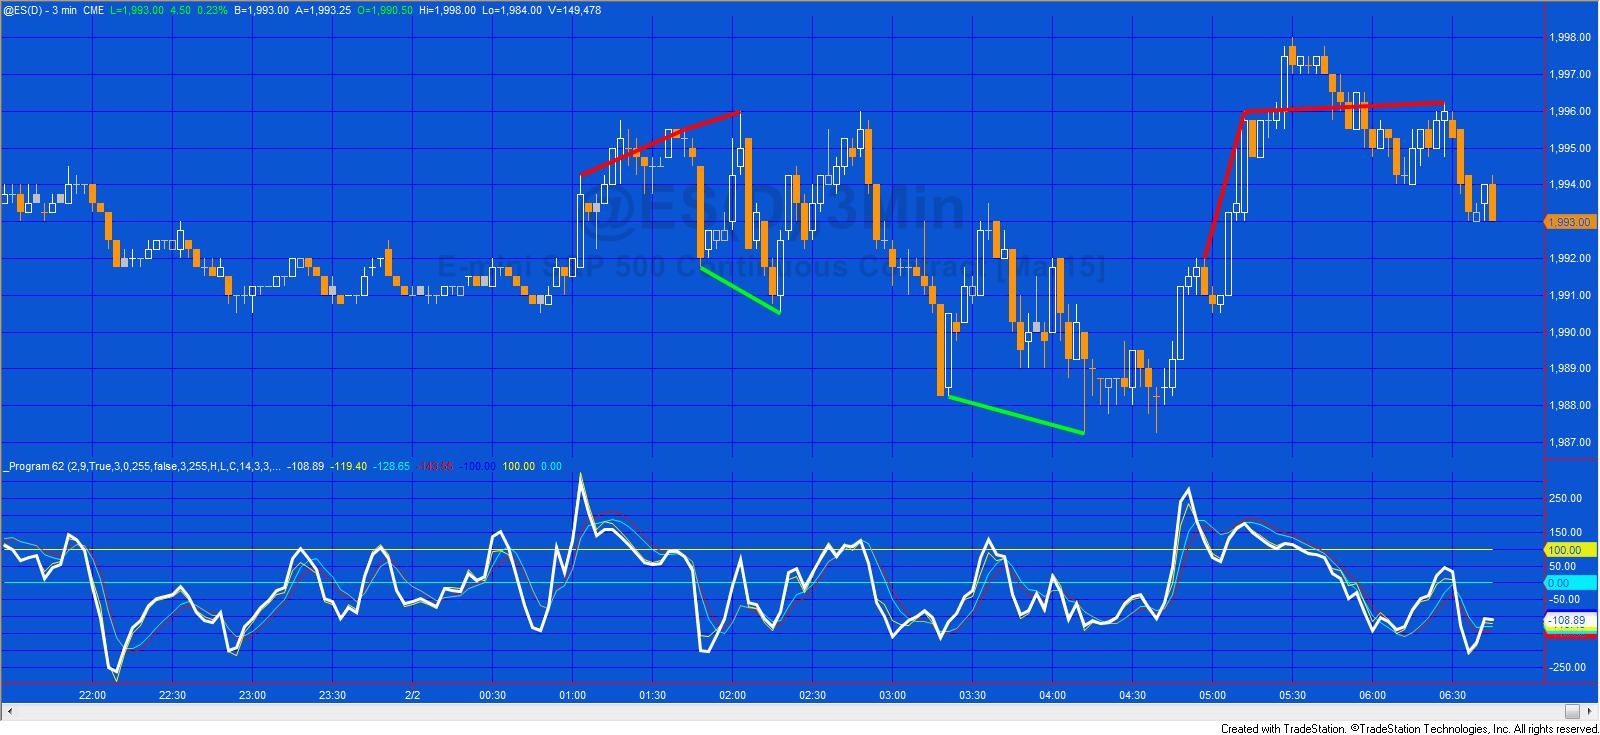
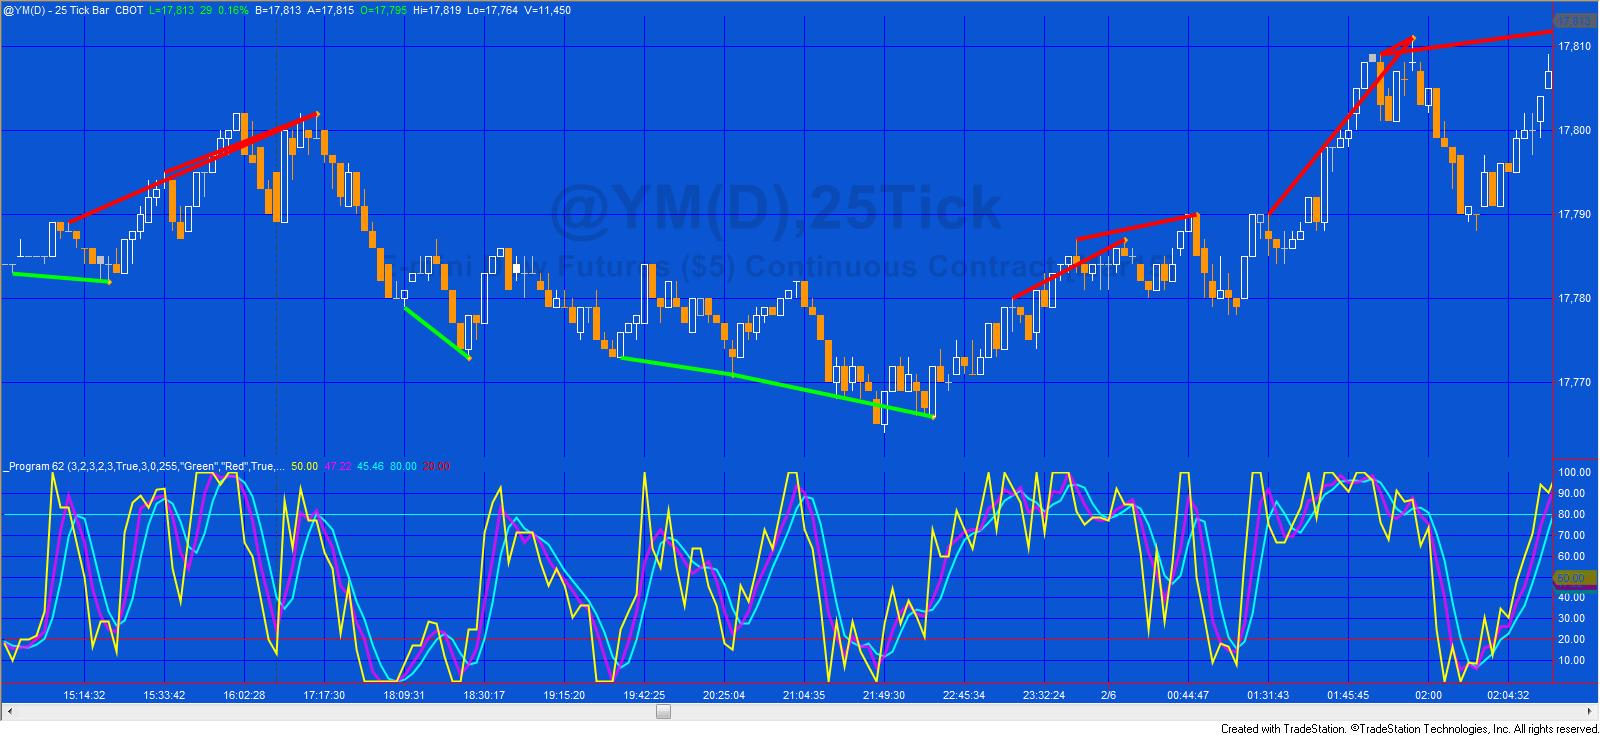
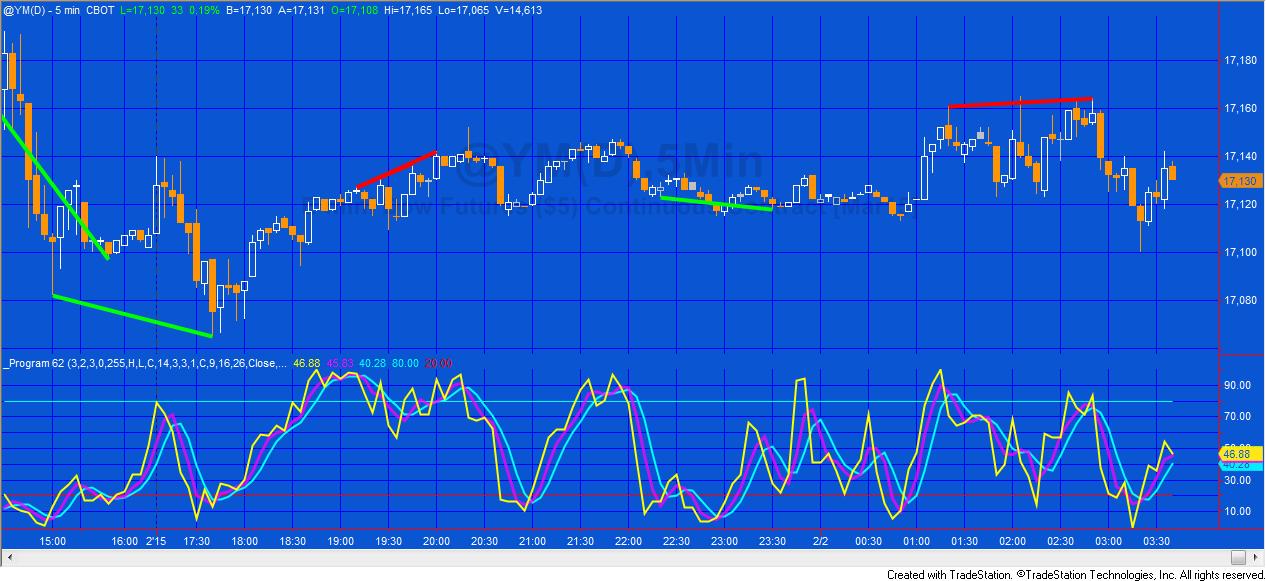
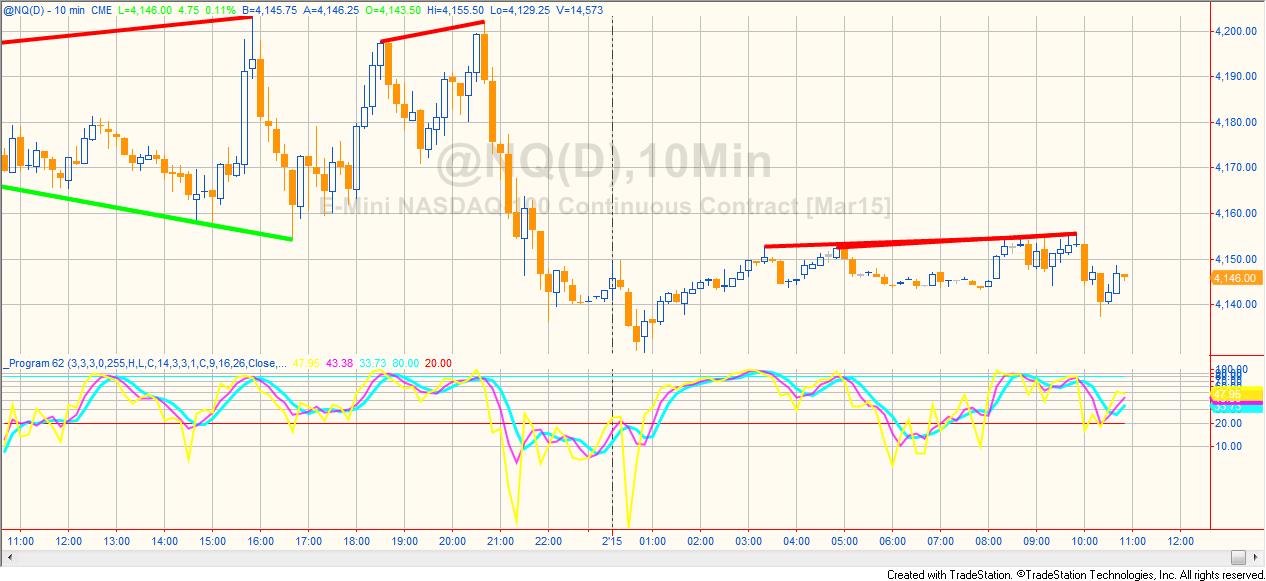
Some technical analysts believe that bullish and bearish divergences in an oscillator may foreshadow price reversals. Program 62 is a TradeStation indicator developed using EasyLanguage designed to look for potential divergences between price and one of the following oscillators:
- Stochastic
- Relative Strength Index (RSI)
- True Strength Index (TSI)
- Commodity Channel Index (CCI)
- Moving Average Convergence/Divergence (MACD)
- Stochastic of RSI
Program 62 combines the capabilities of programs 27, 28, 30, 42, and 60 in ONE program. I have rewritten the program to calculate divergence for any of the above oscillators (selectable by a user input). The program, written for TradeStation 9.1 and higher, also works with second, tick, kagi, Kase, line break, momentum, point and figure, range, renko charts. There were difficulties with programs 27, 28, 30, and 42, in drawing the divergence lines between pivots because various bars shared the same time stamp. This is no longer a problem as program 62 uses the new TradeStation drawing objects.
This program does not work with MultiCharts.
After selecting an oscillator, the user can choose the option of plotting divergences between price and different outputs from the oscillator. For example, with the Stochastic oscillator, the program also looks for divergence between price and the stochastic. The user may select (by user input) whether to use:
- oFastK
- oFastD
- or oSlowD
to search for divergence (see user inputs below).
Or, for example, with the commodity channel index (CCI) the user may select one of the following to search for divergence:
- CCI
- CCIFast
- SmoothCCI
- or SmoothCCIFast
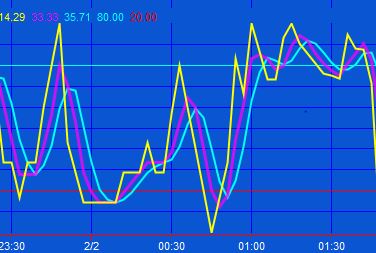
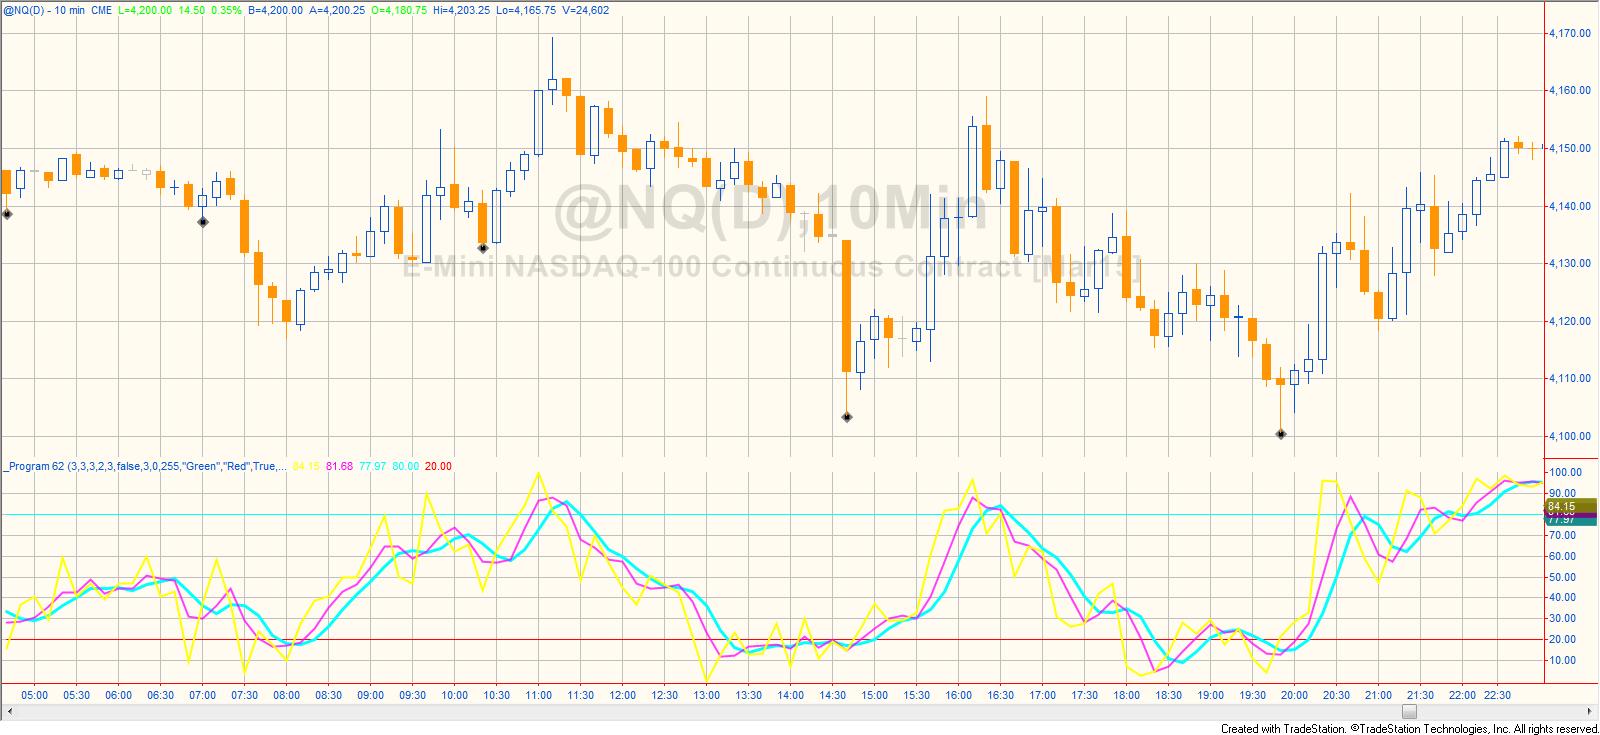
Program 62 also plots the oscillator selected by the user and gives a visual indication of which sub-option of the oscillator is being used by varying the width of the plot. So for example, if oFastD were selected, oFastK, oFastD, and oSlowD would all be plotted but oFastD would have a greater thickness.
When a potential divergence is found a line is drawn between price pivots corresponding to pivots in the oscillator. Since price and the oscillator pivots do not necessarily occur on exactly the same bar, the program has a user input to determine how many bars apart the price pivot and the stochastic pivot can occur to still be considered a price/oscillator pivot pair. The price pivot can occur before the oscillator pivot, or vice versa.
Oscillator options
| WhichOsc user input values | Oscillator | Oscillator sub option |
|---|---|---|
| 1 | Stochastic | oFastK |
| 2 | Stochastic | oFastD |
| 3 | Stochastic | oSlowD |
| 4 | MACD | MACD |
| 5 | MACD | MACD average |
| 6 | MACD | MACD difference |
| 7 | RSI | RSI |
| 8 | RSI | RSI average |
| 9 | CCI | CCI |
| 10 | CCI | Fast CCI |
| 11 | CCI | Smoothed CCI |
| 12 | CCI | Smoothed fast CCI |
| 13 | TSI | TSI |
| 14 | TSI | TSI average |
| 15 | Stochastic of RSI | StochRSI |
| 16 | Stochastic of RSI | SmoothSRSI |
The difference between programs 27, 28, 30, 42, and 60 and tutorial 26
The tutorial 26 program looks for the two most recent pivots in price and the two most recent in the oscillator. It then compares the price pivots and oscillator pivots (provided they occur within a user input number of bars of each other) to see if a divergence has occurred. So for a low pivot, price would have made a lower low pivot and the oscillator would have made a higher low pivot.
Program 62 and programs 27, 28, 30, 42, and 60 work in a different way. With these programs, each time a new price/oscillator pivot pair is found the bar number of the price bar, the value of the price pivot and the value of the oscillator pivot are stored in an array. The most recent price pivot is compared with all the price pivots stored in an array and at the same time the most recent oscillator pivot is compared with all the corresponding oscillator pivots stored in the array. If a divergence is found between any of these combinations, a line is drawn on the chart between the two price pivots.
Program download
Program 62 was developed for TradeStation 9.1 and above, including versions 9.5 and 10.0.
This PROTECTED program (i.e. the TradeStation EasyLanguage indicator is fully functional but you cannot see the source code) is available for immediate download for $145- by clicking the ‘add to cart’ button to pay using Credit card or PayPal.
An UNPROTECTED version (i.e. the TradeStation EasyLanguage indicator is fully functional and you can see the source code) is also available for for immediate download for $245- by clicking the ‘add to cart’ button. Because this version is unprotected you can open it, see the program code and modify it.
If you are a Gold Pass member make sure you enter the special coupon code to get 20% discount off these prices.
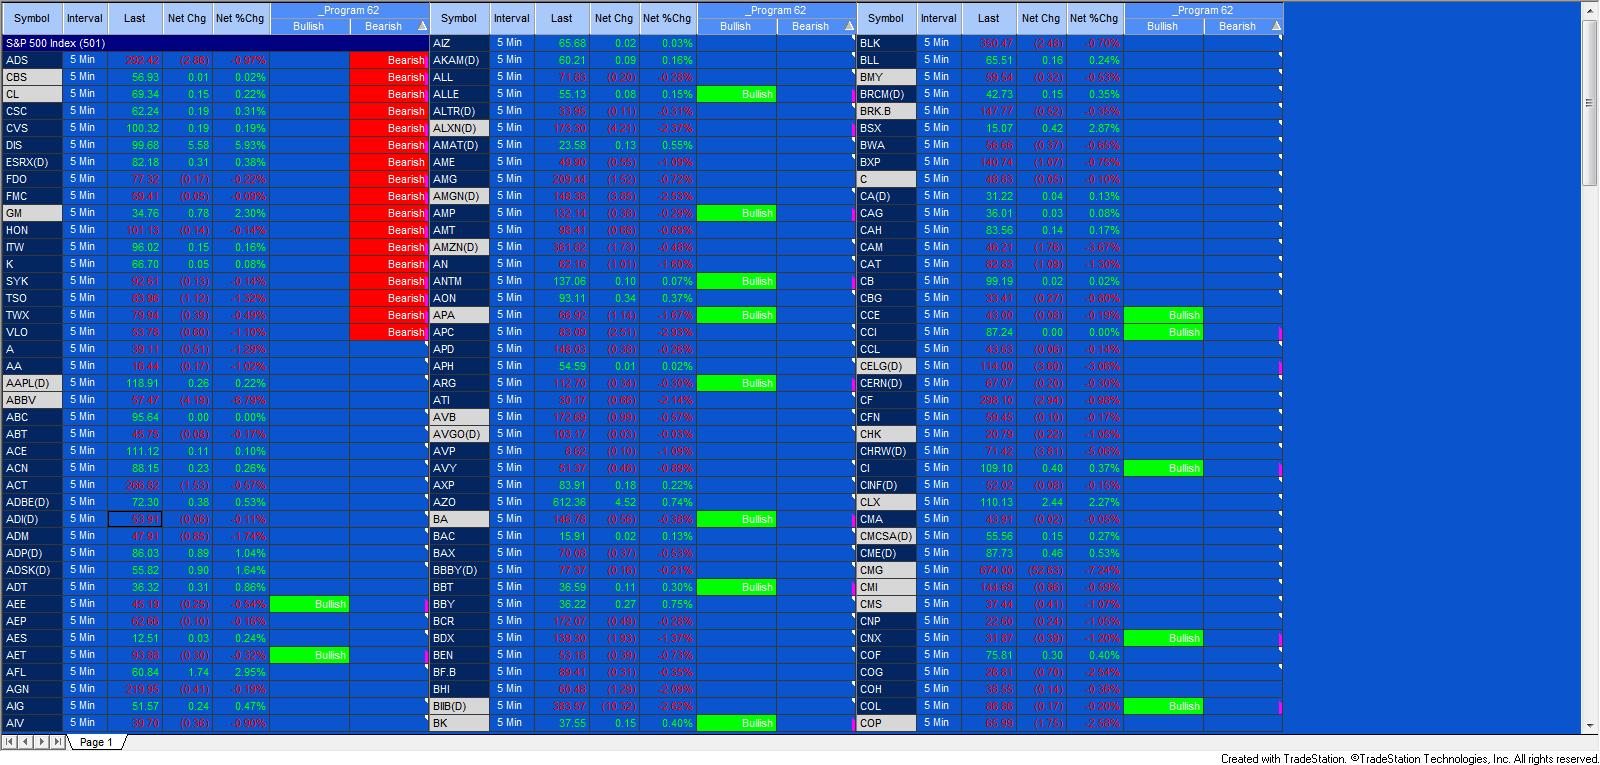
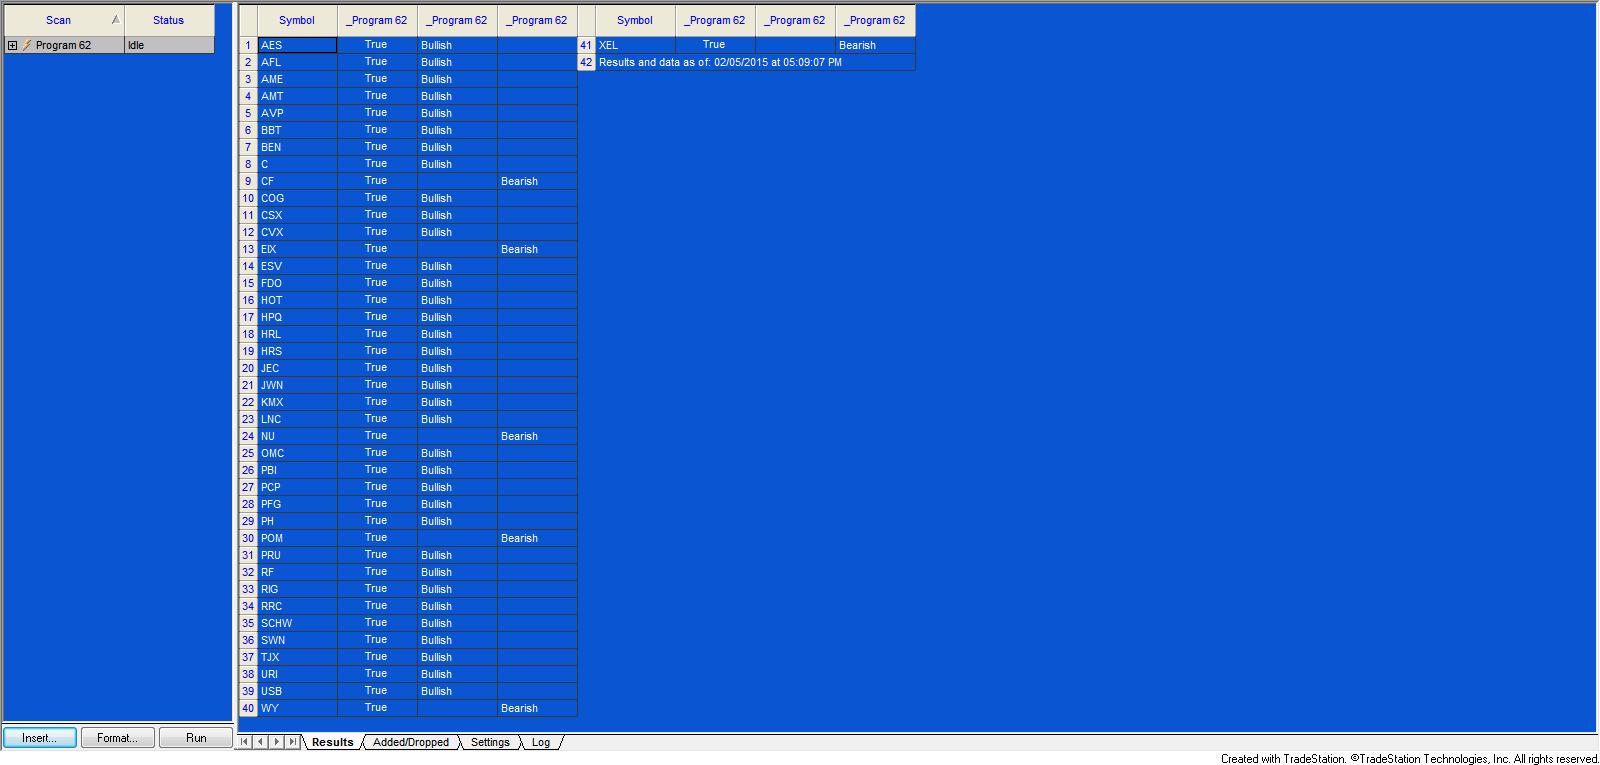
The program may be applied to charts, RadarScreen, and/or the scanner. It also includes alert functionality which may be controlled by the indicator settings.
Inputs
Note: inputs for a specific oscillator only take effect is that oscillator is selected using the WhichOsc input.
The word before the input name is the data type as follows:
- int = integer (i.e. 0, 1, 2, 3 )
- bool = boolean (i.e. true or false)
- double = double(i.e. 2.34236)
- string = string (i.e. “words”)
After the input names is a brief explanation of its use. The ‘//’ tells the program that the words are comments and they do not affect the running of the program.
The number contained within parentheses is the default value for the user input. This means that the program will run with this value unless you change it.
Input values
int MaxArraySize( 3 ), // Maximum = 5. Determines how many previous pivots are compared each time a new price pivot and corresponding Stochastic pivot are discovered
int WhichOsc( 1 ), // Determines which oscillator the program uses to test for divergence
// Pivot inputs
int LeftStrength( 3 ), // Left strength of pivots
int RightStrength( 2 ), // Right strength of pivots
int BarTol( 3 ), // The number of bars within which the price and Stochastic pivot must occur for the pivots to be considered to have occurred on the same bar
// Trendline attributes
bool DrawTL( True ),
int TLWeight( 3 ), // Determines the thickness oof the trendline. Valid numbers are integers between 0 and 6
int TLStyle( 0 ), // 0 = solid, 1 = dashed, 2 = dotted, 3 = dashed2, 4 = dashed3
int TLTransparency( 255 ), // Sets the alpha component (transparency) of this color structure, where 0 is fully transparent and 255 is fully opaque
string LowerColor( “Green” ), // Color of lines indicating possible bullish divergence
string UpperColor( “Red” ), // Color of lines indicating possible bearish divergence
// Ellipse attributes
bool DrawEllipse( True ),
int EWeight( 3 ), // Must equal 0, 1, 2, 3, or 4
string FillColor( “Yellow” ), // Fill color of the ellipse
string BorderColor( “Orange” ), // Border color of the ellipse
// Stochastic inputs
double StochPriceH( High ), // Input to stochastic calculation and price used to find high pivots
double StochPriceL( Low ), // Input to stochastic calculation and price used to find low pivots
double StochPriceC( Close ), // Input to stochastic calculation
int StochLength( 14 ), // Input to stochastic calculation
int StochLength1( 3 ), // Used to slow FastK to FastD = SlowK
int StochLength2( 3 ), // Used to slow FastD to SlowD
int StochSmoothType( 1 ), // StochSmoothType = 1 for Original, StochSmoothType = 2 for Legacy }
double StochOverSold( 20 ), // Horizontal line plotted at this level
double StochOverBought( 80 ), // Horizontal line plotted at this level
// MACD inputs
double MACDPrice( Close ), // Input to MACD
int MACDLength( 9 ), // Input to MACD
int MACDFastLength( 16 ), // Input to MACD
int MACDSlowLength( 26 ), // Input to MACD
// TSI inputs
double TSIPrice( Close ), // Input to True Strength Index calculation
int TSIPeriod1( 25 ), // Input to True Strength Index calculation
int TSIPeriod2( 13 ), // Input to True Strength Index calculation
int TSIPeriod3( 5 ), // Input to True Strength Index calculation
// RSI inputs
double RSIPrice( Close ), // Used in RSI calculation
int RSILength1( 10 ), // Used in RSI calculation
int RSILength2( 5 ), // Used in Exponential moving average of RSI calculation
double RSIOverSold( 30 ), // Used to draw horizontal line at the user input level
double RSIOverBought( 70 ), // Used to draw horizontal line at the user input level
// CCI inputs
int CCILength( 14 ), // CCI length
int CCIFastLength( 6 ), // Length of ‘fast’ CCI
int CCISmoothLength( 14 ), // Factor used to smooth CCI
int FastCCISmoothLength( 14 ), // Factor used to smooth fast CCI
double CCIOverSold( -100 ), // Used to draw horizontal line at the user input level
double CCIOverBought( 100 ), // Used to draw horizontal line at the user input level
// Stochastic of RSI
double SRSIPrice( Close ), // Price input to SRSI calculation
double SRSIOverSold( 20 ), // Horizontal line plotted at this level
double SRSIOverBought( 80 ), // Horizontal line plotted at this level
double SRSIPrice( Close ), // Price used in RSI calculation
int SRLength( 14 ), // Length used in the RSI calculation
int SRSICCISmoothLength( 5 ); // Smoothing length used to smooth the stochastic of the RSI
Available Colors
| AliceBlue | DarkSlateGray | LightSalmon | PaleVioletRed |
| AntiqueWhite | DarkTurquoise | LightSeaGreen | PapayaWhip |
| Aqua | DarkViolet | LightSkyBlue | PeachPuff |
| Aquamarine | DeepPink | LightSlateGray | Peru |
| Azure | DeepSkyBlue | LightSteelBlue | Pink |
| Beige | DimGray | LightYellow | Plum |
| Bisque | DodgerBlue | Lime | PowderBlue |
| Black | Firebrick | LimeGreen | Purple |
| BlanchedAlmond | FloralWhite | Linen | Red |
| Blue | ForestGreen | Magenta | RosyBrown |
| BlueViolet | Fuschia | Maroon | RoyalBlue |
| Brown | Gainsboro | MediumAquamarine | SaddleBrown |
| Burlywood | GhostWhite | MediumBlue | Salmon |
| CadetBlue | Gold | MediumOrchid | SandyBrown |
| Chartreuse | Goldenrod | MediumPurple | SeaGreen |
| Chocolate | Gray | MediumSeaGreen | Seashell |
| Coral | Green | MediumSlateBlue | Sienna |
| CornflowerBlue | GreenYellow | MediumSpringGreen | Silver |
| Cornsilk | Honeydew | MediumTurquoise | SkyBlue |
| Cyan | HotPink | MediumVioletRed | SlateBlue |
| DarkBlue | IndianRed | MidnightBlue | SlateGray |
| DarkBrown | Indigo | MintCream | Snow |
| DarkCyan | Ivory | MistyRose | SpringGreen |
| DarkGoldenrod | Khaki | Moccasin | SteelBlue |
| DarkGray | Lavender | NavajoWhite | Tan |
| DarkGreen | LavenderBlush | Navy | Teal |
| DarkKhaki | LawnGreen | OldLace | Thistle |
| Dark Magenta | LemonChiffon | Olive | Tomato |
| DarkOliveGreen | LightBlue | OliveDrab | Turquoise |
| DarkOrange | LightCoral | Orange | Violet |
| DarkOrchid | LightCyan | OrangeRed | Wheat |
| DarkRed | LightGoldenrodYellow | Orchid | White |
| DarkSalmon | LightGray | PaleGoldenrod | WhiteSmoke |
| DarkSeaGreen | LightGreen | PaleGreen | Yellow |
| DarkSlateBlue | LightPink | PaleTurquoise | YellowGreen |
Video demonstration of program 62 | introduction and using on a chart
Video demonstration of program 62 | introduction and using on RadarScreen
Video demonstration of program 62 | introduction and using on Scanner
This PROTECTED program (i.e. the TradeStation EasyLanguage indicator is fully functional but you cannot see the source code) is available for immediate download for $145- by clicking the ‘add to cart’ button to pay using Credit card or PayPal.
An UNPROTECTED version (i.e. the TradeStation EasyLanguage indicator is fully functional and you can see the source code) is also available for for immediate download for $245- by clicking the ‘add to cart’ button. Because this version is unprotected you can open it, see the program code and modify it.
If you are a Gold Pass member make sure you enter the special coupon code to get 20% discount off these prices.
Oscillator descriptions
Relative strength index (RSI)
The relative strength index (RSI) was developed by J. Welles Wilder and is a momentum oscillator that measures the speed and change of price movements. It oscillates between zero and 100.
Moving average convergence divergence (MACD)
The moving average convergence divergence (MACD) returns the difference between a fast and slow exponential moving average based on the same price.
Stochastic
The stochastic oscillator is a momentum indicator that shows the location of the close relative to the high-low range over a set number of periods. It follows the momentum of price.
True strength index (TSI)
The true strength index (TSI) is a momentum-based indicator, originally developed by William Blau. It is used to find the trend and overbought/oversold conditions.
Commodity channel index (CCI)
The commodity channel index (CCI) is an oscillator introduced by Donald Lambert in 1980. It is calculated as the difference between the typical price of a commodity and its simple moving average, divided by the mean absolute deviation of the typical price. In TradeStation the index is scaled by an inverse factor of 0.015.
Stochastic of RSI
The stochastic of the RSI is calculated using the following formula:
TrueStrengthIndex = 100 * _Divide( XAverage( XAverage( Price – Price[1], TSIPeriod1 ), TSIPeriod2 ), XAverage( XAverage( AbsValue( Price – Price[1] ), TSIPeriod1 ), TSIPeriod2 ) );
XAvgTSI = XAverage( TrueStrengthIndex, TSIPeriod3 );
_Divide is a function that divides the first input by the second, while checking for divide by zero errors.
Please note that any screen shots on this site are examples and are not meant to imply that any of these programs will generate profitable trades. THESE INDICATORS, SHOW ME STUDIES, STRATEGIES AND OTHER PROGRAMS HAVE BEEN INCLUDED SOLELY FOR EDUCATIONAL PURPOSES.
TO THE BEST OF MARKPLEX CORPORATION’S KNOWLEDGE, ALL OF THE INFORMATION ON THIS PAGE IS CORRECT, AND IT IS PROVIDED IN THE HOPE THAT IT WILL BE USEFUL. HOWEVER, MARKPLEX CORPORATION ASSUMES NO LIABILITY FOR ANY DAMAGES, DIRECT OR OTHERWISE, RESULTING FROM THE USE OF THIS INFORMATION AND/OR PROGRAM(S) DESCRIBED, AND NO WARRANTY IS MADE REGARDING ITS ACCURACY OR COMPLETENESS. USE OF THIS INFORMATION AND/OR PROGRAMS DESCRIBED IS AT YOUR OWN RISK.
ANY EASYLANGUAGE OR POWERLANGUAGE TRADING STRATEGIES, SIGNALS, STUDIES, INDICATORS, SHOWME STUDIES, PAINTBAR STUDIES, PROBABILITYMAP STUDIES, ACTIVITYBAR STUDIES, FUNCTIONS (AND PARTS THEREOF) AND ASSOCIATED TECHNIQUES REFERRED TO, INCLUDED IN OR ATTACHED TO THIS TUTORIAL OR PROGRAM DESCRIPTION ARE EXAMPLES ONLY, AND HAVE BEEN INCLUDED SOLELY FOR EDUCATIONAL PURPOSES. MARKPLEX CORPORATION. DOES NOT RECOMMEND THAT YOU USE ANY SUCH TRADING STRATEGIES, SIGNALS, STUDIES, INDICATORS, SHOWME STUDIES, PAINTBAR STUDIES, PROBABILITYMAP STUDIES, ACTIVITYBAR STUDIES, FUNCTIONS (OR ANY PARTS THEREOF) OR TECHNIQUES. THE USE OF ANY SUCH TRADING STRATEGIES, SIGNALS, STUDIES, INDICATORS, SHOWME STUDIES, PAINTBAR STUDIES, PROBABILITYMAP STUDIES, ACTIVITYBAR STUDIES, FUNCTIONS AND TECHNIQUES DOES NOT GUARANTEE THAT YOU WILL MAKE PROFITS, INCREASE PROFITS, OR MINIMIZE LOSSES.