
Convergent Fibonacci levels placed in GlobalVariable.DLL
Program 74 allows a user to draw trend lines on a chart with the drawing tools, for which Fibonacci retracement levels are automatically calculated and drawn. As new trend lines are added, program 74 calculates when the Fibonacci levels (horizontal lines) relating to the drawn lines are ‘convergent’ (close to each other according to a user input). The convergent lines are drawn on the chart and their price levels are stored in the Global Variable DLL.
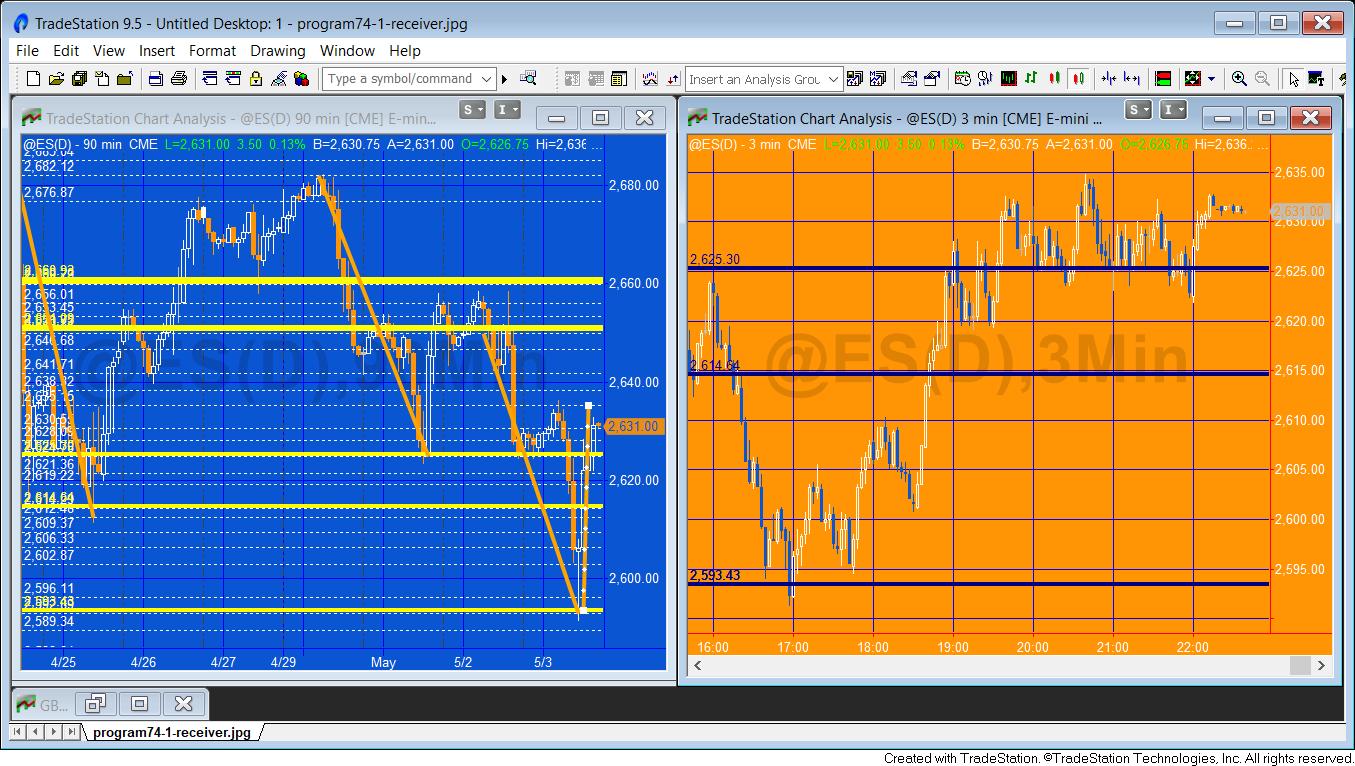
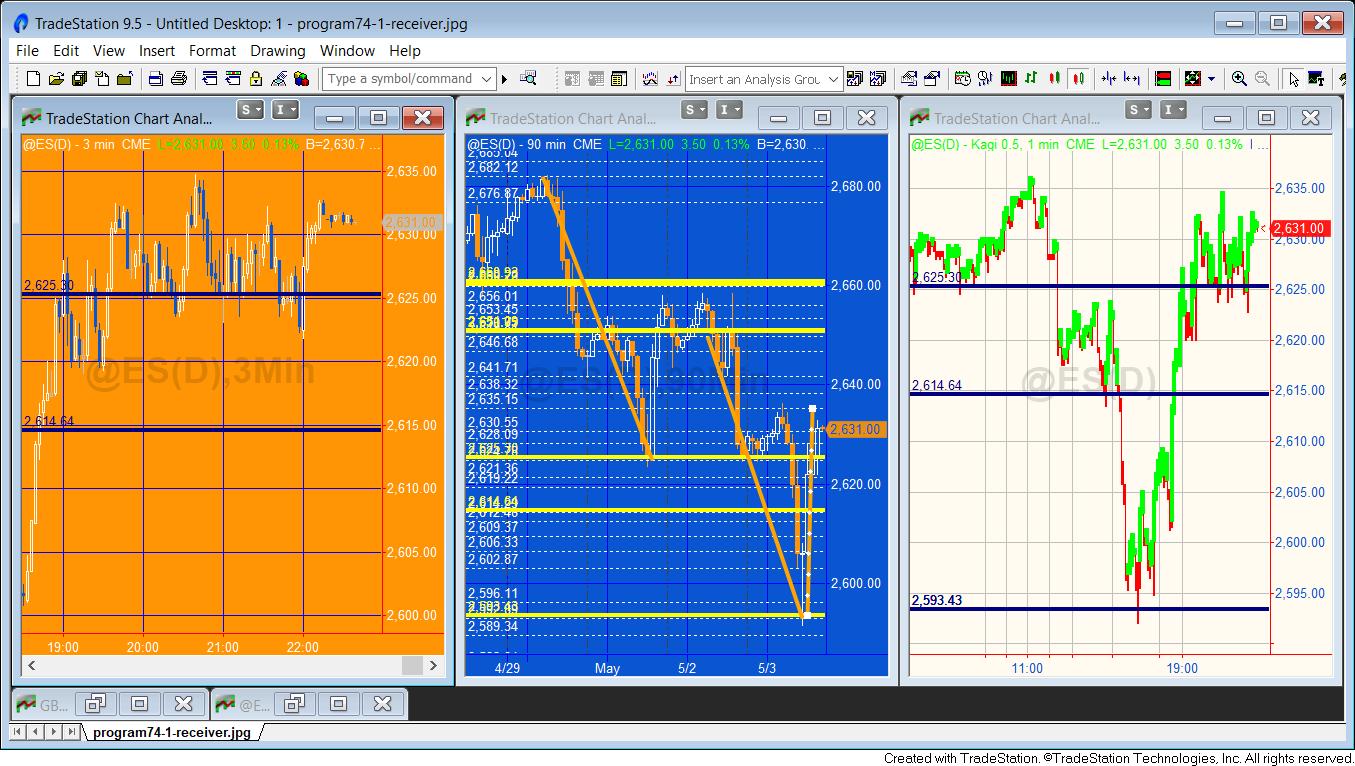
A separate receiver program reads the information from the GlobalVariable.DLL and draws lines on charts where it is inserted.
The idea is similar to Program 1 | Fibonacci Zig Zag Confluence, but this new program gives the user the flexibility to draw their own zig-zag lines and makes the data available to other charts.
- The first ( _Program74, a show me study) calculates Fibonacci levels on the chart and calculates convergence levels and stores them in the GlobalVariable.DLL
- The second program (_Program74-Receiver, an indicator) retrieves convergent levels data from the GlobalVariable.DLL and draws them on the chart or charts to which it is applied.
- The _VectorQuickSort function is used by _Program74 to sort one of the vectors.
All three programs are available for immediate download below.
N.B. For the program to work you will need to make sure that GlobalVariable.DLL is installed. This program is easy to install and is available at no cost on the TradeStation forum.
Video demonstration | Part 1
Video demonstration | Part 2
Program download
These TradeStation EasyLanguage programs are fully functional and unprotected, i.e. you can see the source code.
After download the program can be opened, you will be able to see the program code and modify it. After purchase you will be redirected to a download page, so don’t close the browser.
Note that the program 74 package was developed for TradeStation 9.5 and above and is not compatible with MultiCharts.
Programming techniques used in the programs
- Programmatically retrieve data about trendlines drawn with the drawing tools
- Add a click event to a trend line drawn with the drawing tools
- Detect when a trend line is clicked
- Create and use vector
- Draw horizontal lines
- Store horizontal lines in a vector
- Store a vector in the tag of the trend line
- Store levels in the GlobalVariable.DLL
- Style trend lines and horizontal lines
- Use the _VectorQuickSort function
- Generate an exception of inputs values are incorrect
- Retrieving data from the GlobalVariable.DLL
- Deleting and creating horizontal lines
- Using the timer
How the programs work
The ‘sender’ program _Program74
_Program74-Receiver is an TradeStation show me study.
The main method in this program is called CheckFibConfluence. This method is run when the program is applied or reapplied to the chart, just before a trendline drawing object is deleted, and on a mouse-up event on the chart. The method does the following:
- Deletes all horizontal Fibonacci lines on the chart
- For each trendline on the chart recalculate all the Fibonacci levels and draw corresponding horizontal lines
- Store all the horizontal Fibonacci levels in the vector and sort the vector
- Store levels that are within a user input value near to each other in a ‘confluence vector’
- Draw levels in the confluence vector on the chart and store their values in a global variable
The horizontal lines are stored in the tag for each trendline. This enables them to be deleted for a specific trendlines, if that trendline is deleted.
When a new trendline is added to the chart a click event is added to it and the tag property is set to NULL.
The ‘receiver’ program _Program74-Receiver
_Program74-Receiver is an TradeStation indicator.
The receiver program gets information about the confluence levels calculated by the sender program and draws them on the receiver chart, or charts.
_Program74-Receiver uses a timer object. Each time the timer object elapses it deletes all the horizontal lines on the chart and recreates them based on the levels stored in the GlobalVariable.DLL.
_Program74 inputs
- double ProximityVal( 1 ), // Filter horizontal lines to leave only the ones that are within this value to each other
- string UniqueName( “List” ), // Unique name used for key in global variable. Make sure this is the same string as used in the receiving chart
- // Color the trend line drawn
string TLColor( “Green” ), // Set the trendlines to this color - // Style the Fib lines
string FColor( “White” ), // Set the color of the Fibonacci lines
int FWeight( 0 ), // Set the weight of the Fibonacci lines - // Style the convergence lines
string CColor( “Yellow” ), // Se the color of the convergence lines
int CWeight( 3 ); // Set the weight of the convergence lines
_Program74-Receiver inputs
- string UniqueName( “List” ), // Unique name used for key in global variable. Make sure this is the same string as used in the sending chart
- string FColor( “White” ), // Set the color of the horizontal lines
- int FWeight( 3 ); // Set the weight of the horizontal lines
Using Program 74
After manually drawing some relevant lines on a chart the most important input to set in the sending program is ProximityVal. When all the horizontal lines are analyzed this determines which lines are within this distance of each other to be considered convergent.
If you will use the program to send levels to a chart of a different time frame then you will need to create a value for UniqueName for both the sender program (_Program74) applied to the sender chart and the receiver program (_Program74-Receiver) applied to the receiver chart(s). This name should match for the charts you wish to share information between.
Styling options
On the sending chart, the trendline (i.e. the line you draw manually) can be styled for color using the TLColor input. The horizontal lines that show the calculated Fibonacci levels can be styled for color and weight by FColor and FWeight respectively. The convergent lines can be styled for color and weight by CColor and CWeight respectively.
On the receiving chart, the horizontal lines can be styled for color and weight by FColor and FWeight respectively.
A StopCalculationException is generated if FWeight or CWeight are not acceptable values. Make sure FWeight and CWeight inputs are between 0 and 6.
Color options
| AliceBlue | DarkSlateGray | LightSalmon | PaleVioletRed |
| AntiqueWhite | DarkTurquoise | LightSeaGreen | PapayaWhip |
| Aqua | DarkViolet | LightSkyBlue | PeachPuff |
| Aquamarine | DeepPink | LightSlateGray | Peru |
| Azure | DeepSkyBlue | LightSteelBlue | Pink |
| Beige | DimGray | LightYellow | Plum |
| Bisque | DodgerBlue | Lime | PowderBlue |
| Black | Firebrick | LimeGreen | Purple |
| BlanchedAlmond | FloralWhite | Linen | Red |
| Blue | ForestGreen | Magenta | RosyBrown |
| BlueViolet | Fuschia | Maroon | RoyalBlue |
| Brown | Gainsboro | MediumAquamarine | SaddleBrown |
| Burlywood | GhostWhite | MediumBlue | Salmon |
| CadetBlue | Gold | MediumOrchid | SandyBrown |
| Chartreuse | Goldenrod | MediumPurple | SeaGreen |
| Chocolate | Gray | MediumSeaGreen | Seashell |
| Coral | Green | MediumSlateBlue | Sienna |
| CornflowerBlue | GreenYellow | MediumSpringGreen | Silver |
| Cornsilk | Honeydew | MediumTurquoise | SkyBlue |
| Cyan | HotPink | MediumVioletRed | SlateBlue |
| DarkBlue | IndianRed | MidnightBlue | SlateGray |
| DarkBrown | Indigo | MintCream | Snow |
| DarkCyan | Ivory | MistyRose | SpringGreen |
| DarkGoldenrod | Khaki | Moccasin | SteelBlue |
| DarkGray | Lavender | NavajoWhite | Tan |
| DarkGreen | LavenderBlush | Navy | Teal |
| DarkKhaki | LawnGreen | OldLace | Thistle |
| Dark Magenta | LemonChiffon | Olive | Tomato |
| DarkOliveGreen | LightBlue | OliveDrab | Turquoise |
| DarkOrange | LightCoral | Orange | Violet |
| DarkOrchid | LightCyan | OrangeRed | Wheat |
| DarkRed | LightGoldenrodYellow | Orchid | White |
| DarkSalmon | LightGray | PaleGoldenrod | WhiteSmoke |
| DarkSeaGreen | LightGreen | PaleGreen | Yellow |
| DarkSlateBlue | LightPink | PaleTurquoise | YellowGreen |